View volume overview details
The Volume Overview screen provides a consolidated view of volume data across daily and monthly timeframes for a selected LDC, pool, pipeline, and date range. This screen is primarily used to analyze consumption trends, validate volume sources, and compare daily, estimated, and best volume values.
It enables users to filter volume data using multiple criteria and view results in a flexible, configurable grid layout that supports operational analysis, forecasting, and reconciliation.
Prerequisites
Before working with the Volume Overview screen, ensure the following prerequisites are met:
- The user has permission to access the Volume Overview screen.
- The selected LDC is configured and active.
- Volume data exists for the selected date range.
- Associated pools, pipelines, and facilities are configured, if used in filtering.
Procedure to view volume overview details
Step 1: Navigate to the Volume Overview screen
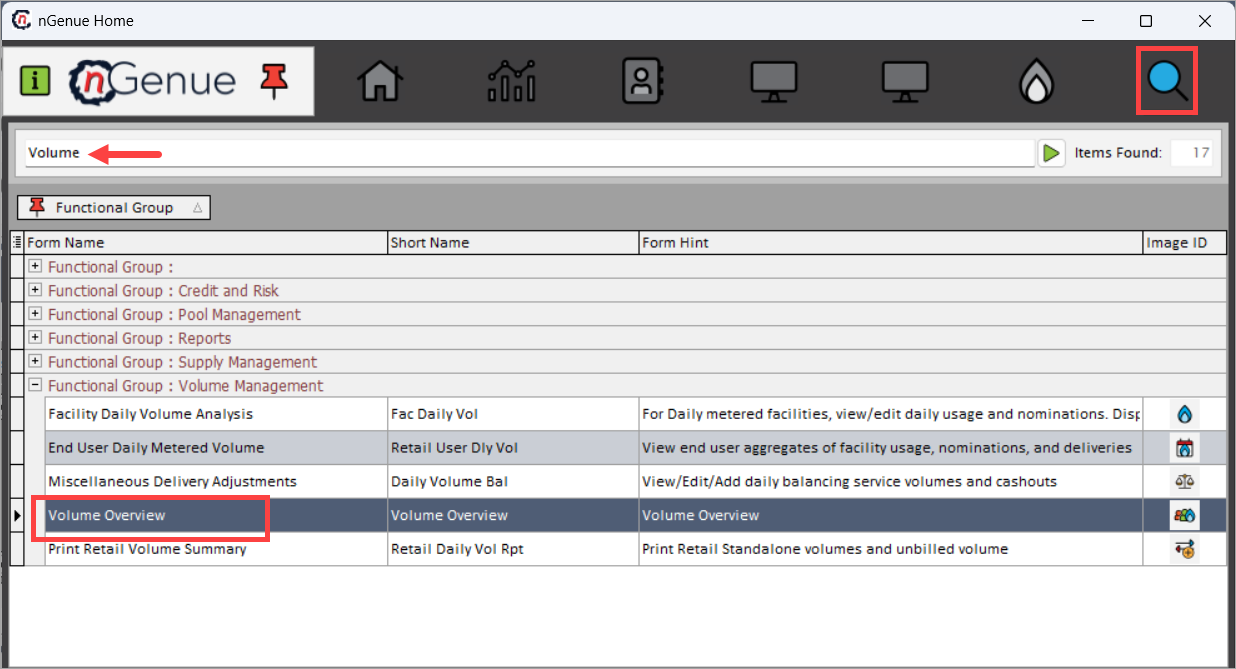
- Log in to the nGenue application.
- Use the Search icon and enter Volume in the search bar.
-
Double-click Volume Overview to open the Volume Overview (Volume Management) screen.
-
The screen is divided into two main sections:
- Filter Query – Used to define search and layout criteria.
- Volume Overview Details – Displays the resulting volume data.
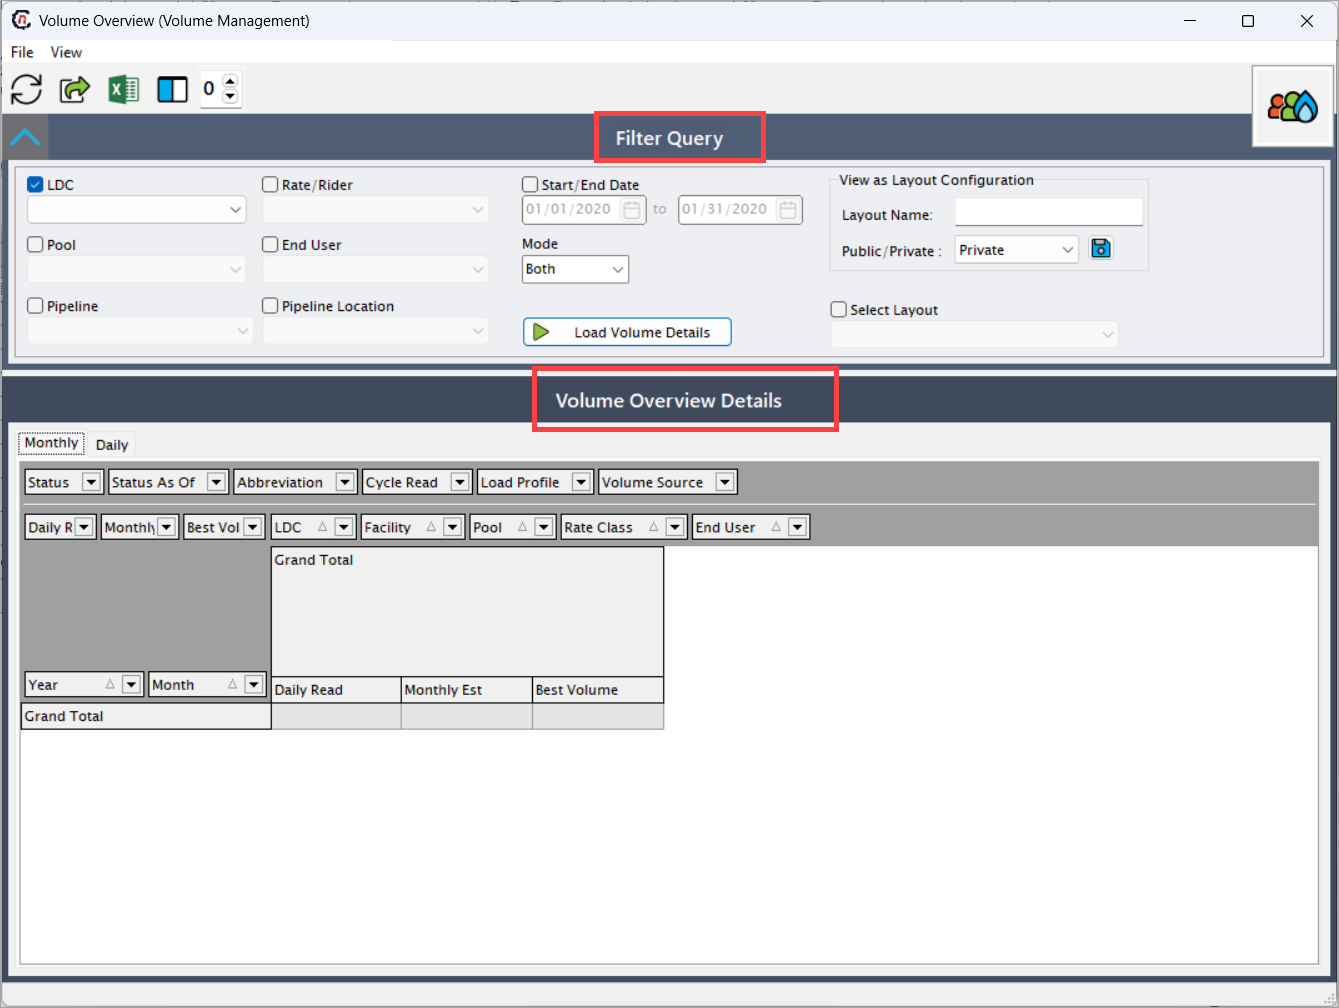
Step 2: Define filter query criteria
Use the Filter Query section to specify how volume data is retrieved and displayed.
| Fields | Description |
|---|---|
| LDC | Select the Local Distribution Company for which volume data is displayed. |
| Rate / Rider | Filters volume data based on the selected rate or rider. |
| Pool | Filters volume data by pool, if applicable. |
| End User | Filters volume data for a specific end user. |
| Pipeline | Filters volume data by pipeline. |
| Pipeline Location | Filters volume data by pipeline location. |
| Start / End Date | Defines the date range for which volume data is retrieved. |
| Mode | Controls whether Daily, Monthly, or Both volume types are included in the results. |
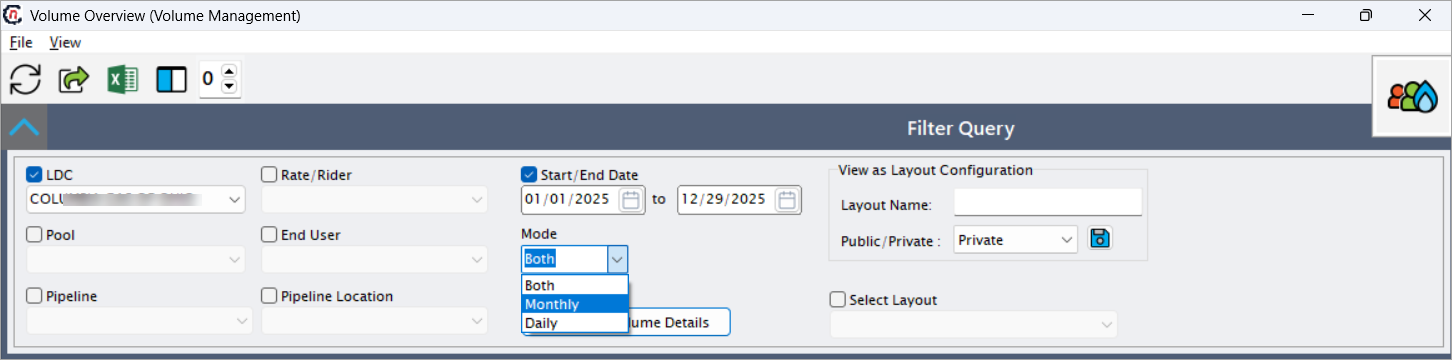
After defining the criteria, click Load Volume Details to retrieve the data.
Step 3: Configure layout options (optional)
The View as Layout Configuration section allows users to manage custom grid layouts.
| Fields | Description |
|---|---|
| Layout Name | Name of the layout configuration being created or selected. |
| Public / Private | Determines whether the layout is available only to the user (Private) or shared (Public). |
| Select Layout | Allows selection of an existing saved layout configuration. |
Layout configurations control column visibility, grouping, and sorting within the results grid.
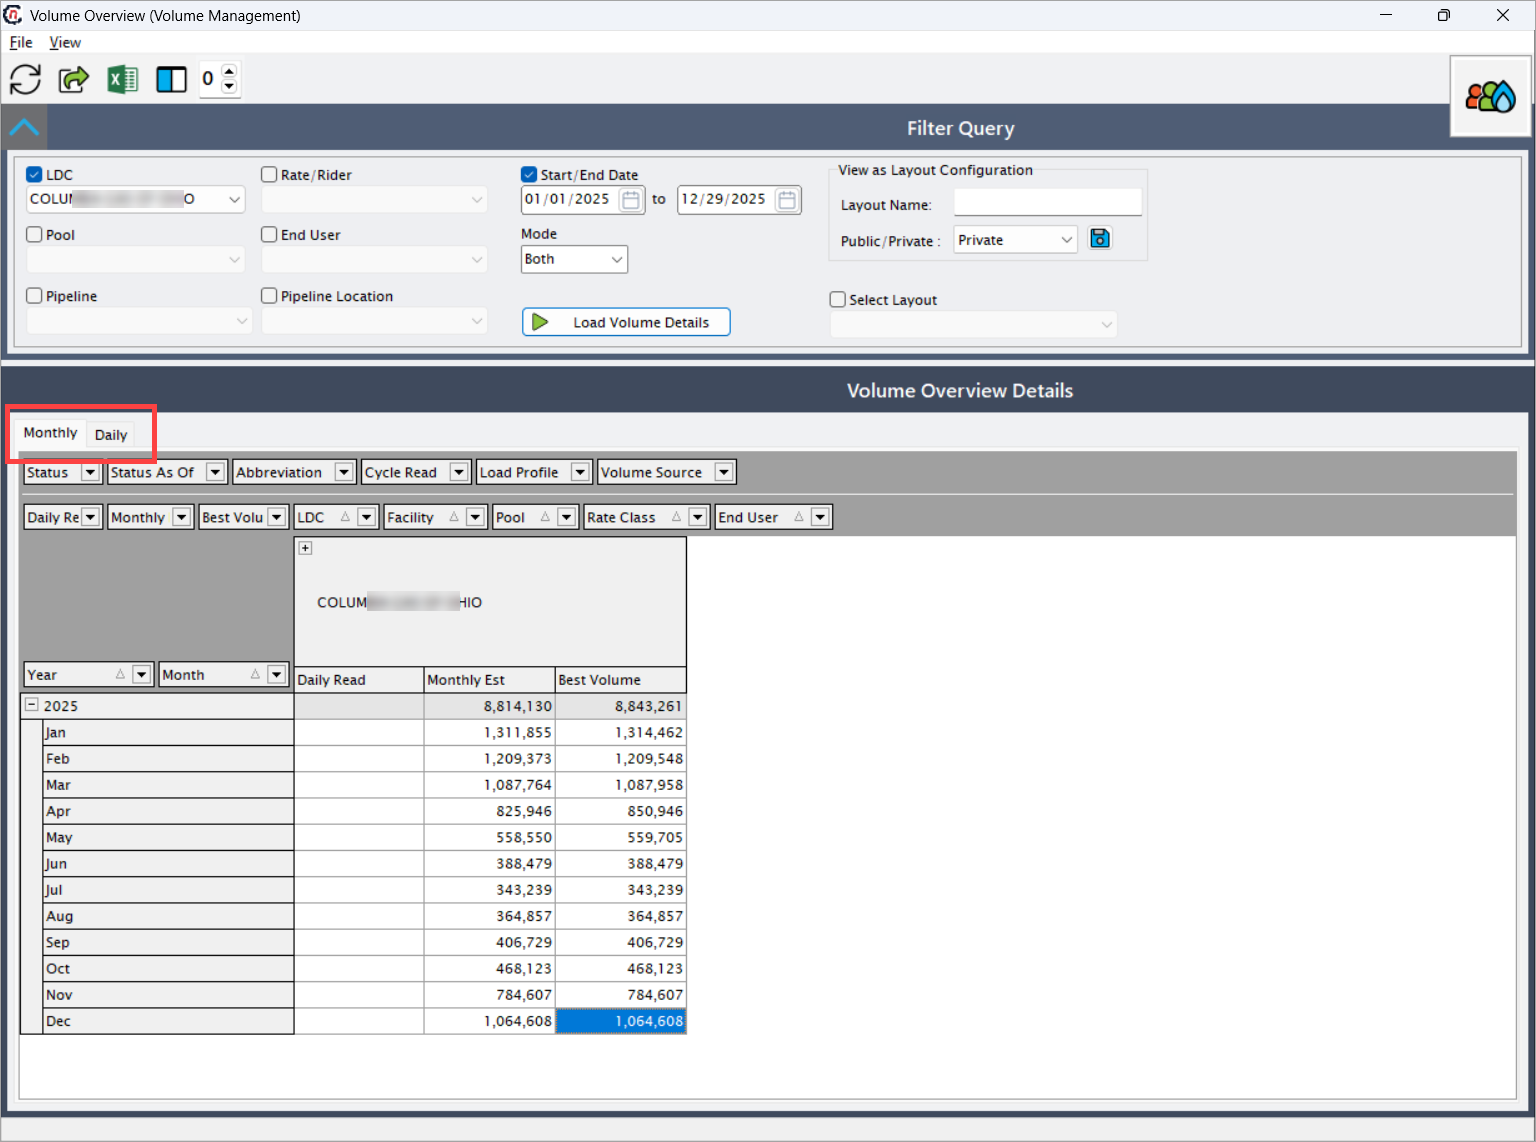
Step 4: Review volume overview details
The Volume Overview Details section displays the retrieved volume data in a grid format. Users can switch between:
- Monthly view – Displays volume data aggregated by month.
- Daily view – Displays volume data at a daily level.
Common data attributes displayed
| Fields | Description |
|---|---|
| Year | Year associated with the volume data. |
| Month | Month associated with the volume data. |
| Daily Read | Actual daily metered volume values, if available. |
| Monthly Estimate | Estimated volume values calculated for the month. |
| Best Volume | System-determined best volume based on available sources. |
| Status | Indicates the processing or posting status of the volume. |
| Status As Of | Date as of which the volume status is applicable. |
| Cycle Read | Identifies the billing or read cycle associated with the volume. |
| Load Profile | Load profile used in volume calculation. |
| Volume Source | Source from which the volume was derived (metered, estimated, projected, etc.). |
| LDC | LDC associated with the volume data. |
| Facility | Facility contributing to the volume. |
| Pool | Pool associated with the volume. |
| Rate Class | Rate class applied to the volume. |
| End User | End user associated with the volume record. |
The grid supports sorting, grouping, and filtering to help analyze volume trends and discrepancies.
Key points
- The Volume Overview screen provides both daily and monthly visibility into volume data.
- Mode selection controls whether daily, monthly, or combined volumes are displayed.
- Best Volume represents the system-selected optimal volume for downstream processes.
- Layout configurations help tailor the view for different analysis needs.
- This screen is commonly used for volume validation, reconciliation, and forecasting review.
Summary
The Volume Overview screen delivers a flexible and comprehensive view of volume data across time periods and operational dimensions. By combining powerful filtering, layout customization, and detailed volume attributes, this screen supports informed decision-making for usage analysis, forecasting, billing validation, and settlement workflows within nGenue.