Physical position projections
The Physical Position Projections screen provides a consolidated, forward-looking view of expected physical gas positions across pipelines, locations, and contracts for a selected delivery period. It combines data from purchases, sales, storage activity, scheduling, and projected scheduling to present a daily projection of receipts, deliveries, and net physical exposure.
This screen is primarily used by pipeline operations, scheduling, trading, and risk teams to:
- Analyze projected supply and demand positions
- Identify potential imbalances before gas day execution
- Validate scheduling assumptions
- Support operational, trading, and risk management decisions
The Physical Position Projections screen focuses on planned and projected volumes, not settled actuals, and serves as a forward-looking operational planning screen.
Prerequisites
Before working on the Physical Position Projections screen, ensure the following prerequisites are met:
- The user has the add or modify permissions for the Physical Position Projections screen.
- Pipelines and pipeline locations are configured and active in nGenue.
- Legal entities, business units, portfolios, and strategies are defined.
- Purchase and sales deals exist for the selected delivery period.
- Storage contracts and associated injection/withdrawal activity are configured (if applicable).
- Scheduling and/or projected scheduling data is available.
Procedure to view physical position projections
Step 1: Navigate to the Physical Position Projections screen
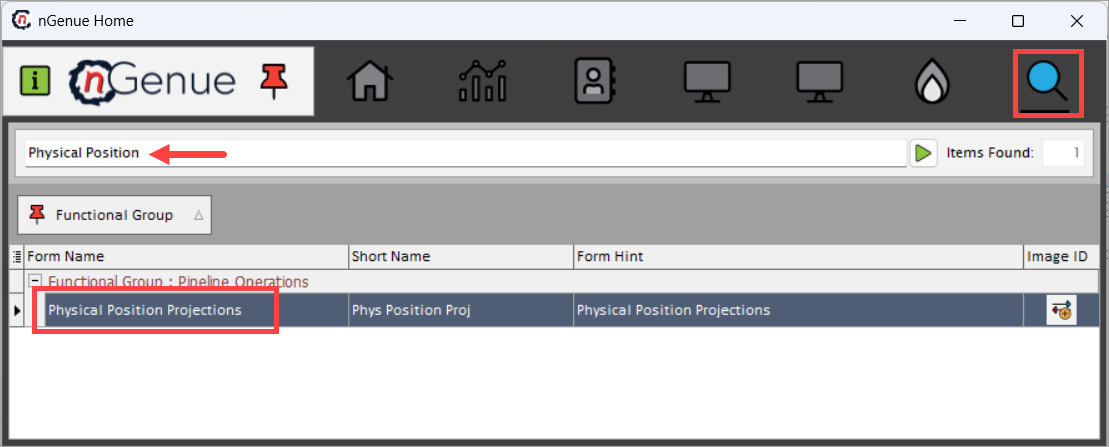
- Log in to the nGenue application.
- Click the Search icon and enter Physical Position in the search bar.
- Double-click Physical Position Projections to open the Physical Position Projections (Pipeline Operations) screen.
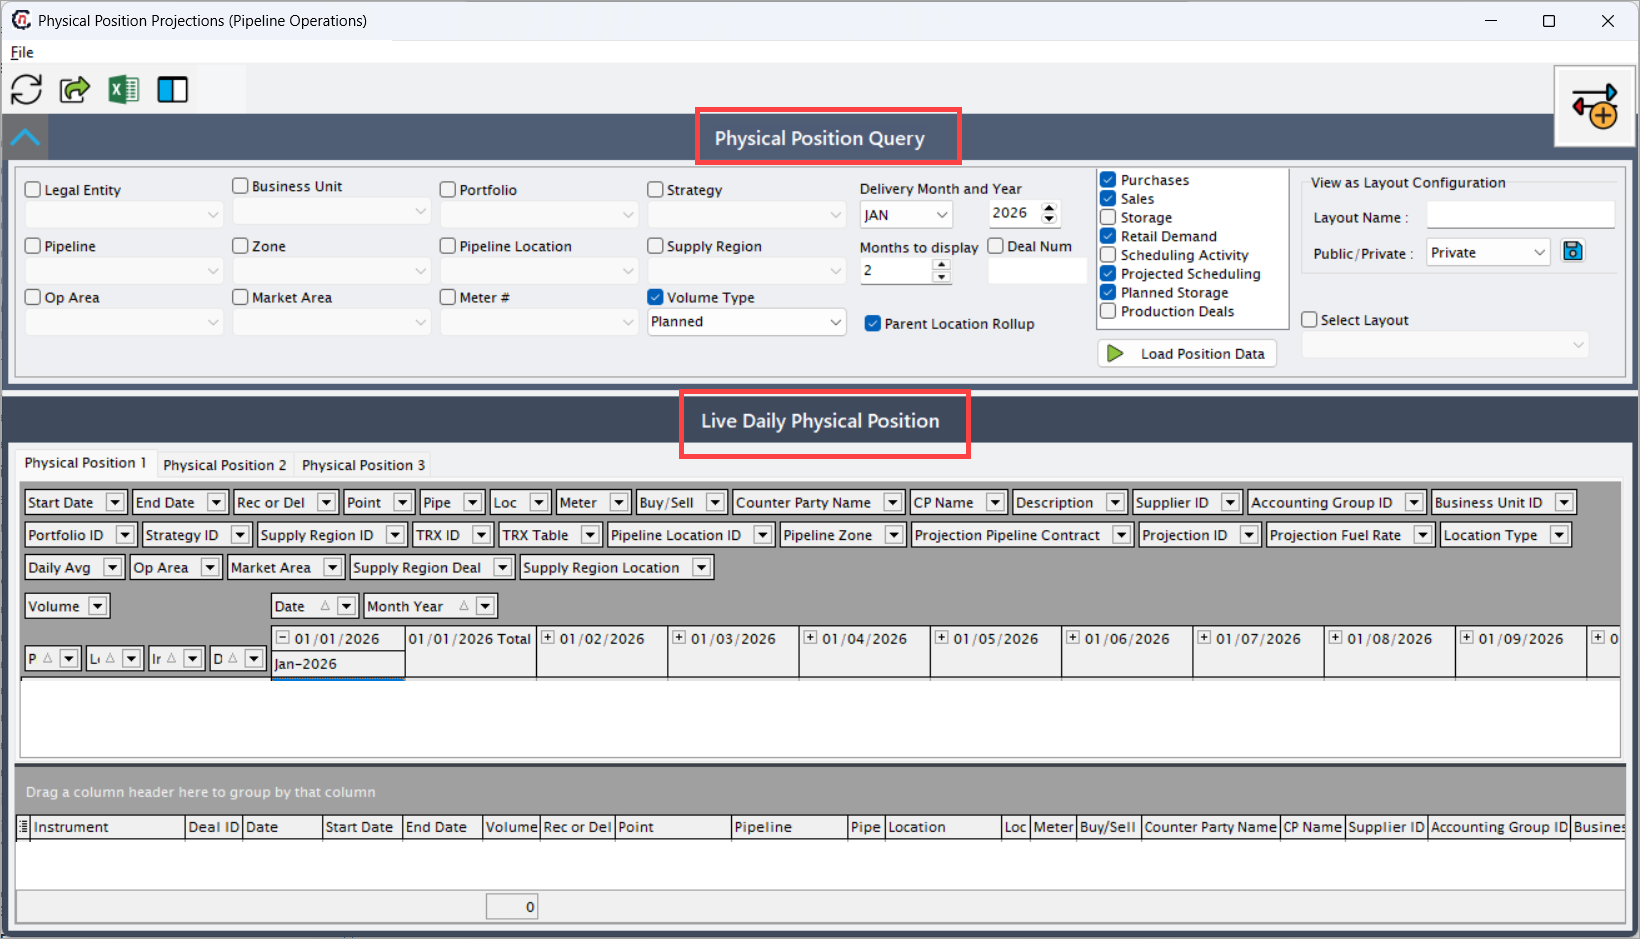
- The screen is divided into two main sections:
- Physical Position Query: This section controls which projected data is loaded and how it is aggregated.
- Live Daily Physical Position: This section displays projected positions in a pivot-style grid, organized by pipeline, location, and date.
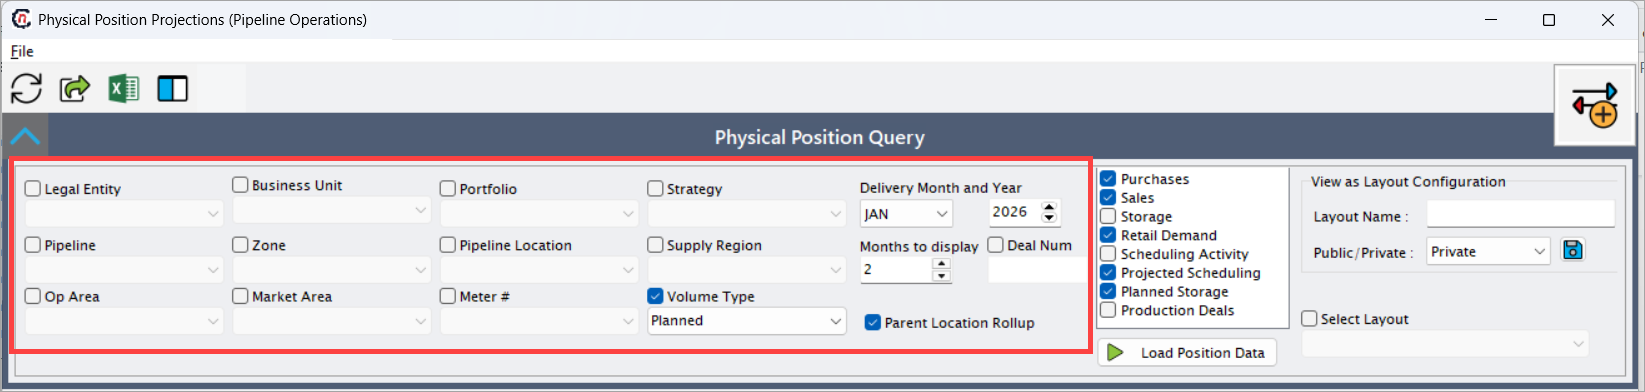
Step 2: Define Physical Position Query criteria
The Physical Position Query section controls which projected data is loaded, the time horizon of projections, and the aggregation logic applied to the results.
Entity and organizational filters
| Field | Description |
|---|---|
| Legal Entity | Filters projected positions by the owning legal entity. This ensures positions are aligned with contractual and regulatory ownership. |
| Business Unit | Limits data to a specific business unit responsible for managing the physical positions and related P&L. |
| Portfolio | Filters positions by portfolio, typically used by trading teams to segregate exposures by book or desk. |
| Strategy | Filters positions associated with a specific trading or operational strategy, such as baseload supply, swing, or balancing strategy. |
| Pipeline | Filters projected positions for a specific pipeline system. Only volumes flowing on the selected pipeline are included. |
| Zone | Limits data to a defined pipeline zone, enabling zone-level imbalance and constraint analysis. |
| Pipeline Location | Filters positions at a specific pipeline location such as receipt point, delivery point, interconnect, or storage point. |
| Supply Region | Filters data by supply region grouping, typically used to aggregate upstream supply sources. |
| Op Area | Limits data to a defined operational area, supporting operational responsibility and regional oversight. |
| Market Area | Filters positions by downstream market area, often used for demand-side and delivery analysis. |
| Meter # | Filters positions tied to a specific meter, providing granular metered-level visibility. |
| Delivery Month and Year | Defines the starting delivery month and year from which projections are displayed. |
| Months to display | Specifies how many future months should be displayed in the grid, expanding the projection horizon. |
| Volume Type | Determines whether Planned (contractual/expected) or Projected (forecasted or modeled) volumes are shown. |
| Parent Location Rollup | When enabled, aggregates child locations under their parent location, simplifying hierarchical location analysis. |
| Deal Num | Filters projected positions by a specific deal number for focused analysis or troubleshooting. |
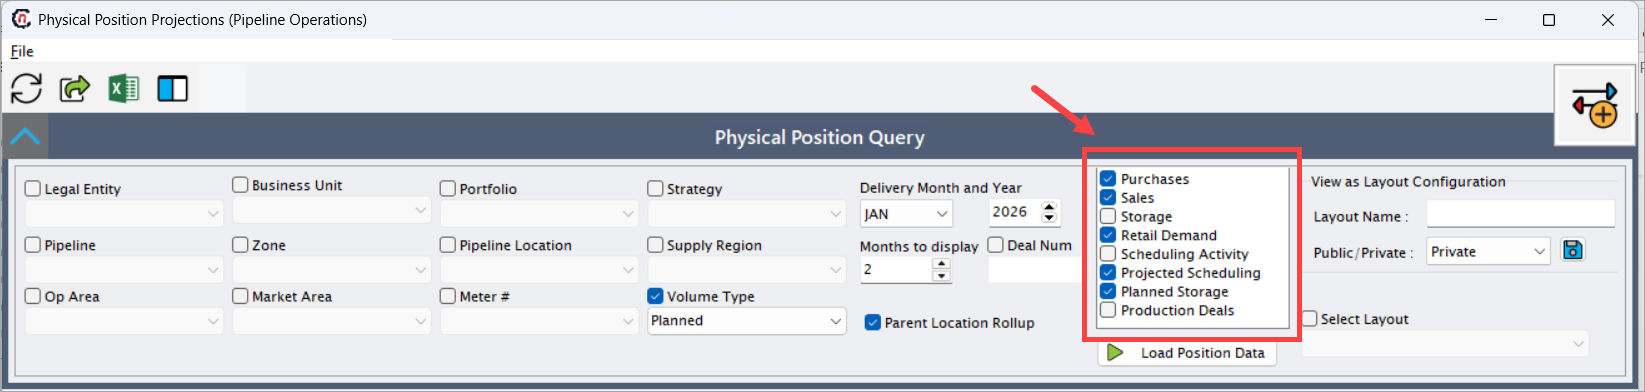
Position components selection
These checkboxes control which data sources contribute to the projected position:
| Option | Description |
|---|---|
| Purchases | Includes projected receipt volumes originating from purchase deals and supply contracts. |
| Sales | Includes projected delivery volumes from sales deals and customer contracts. |
| Storage | Includes actual or projected storage injections and withdrawals. |
| Retail Demand | Includes downstream retail demand projections where retail forecasting is enabled. |
| Scheduling Activity | Includes volumes from confirmed or submitted pipeline nominations. |
| Projected Scheduling | Includes forward-looking scheduling projections generated by planning or forecasting logic. |
| Planned Storage | Includes planned future storage movements not yet scheduled. |
| Production Deals | Includes production-related supply volumes from upstream production contracts. |
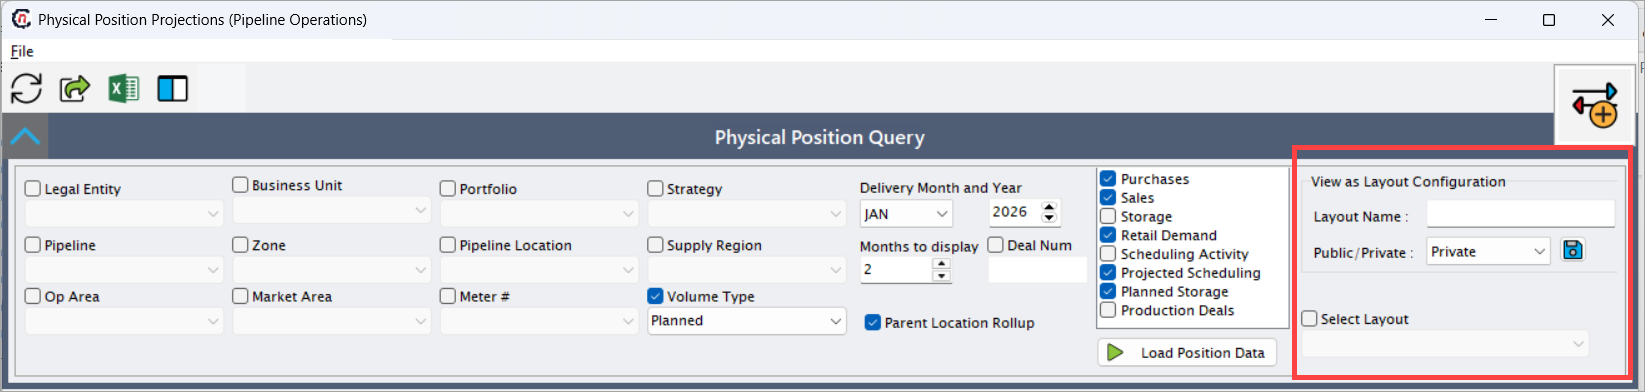
View as layout configuration
The View as Layout Configuration section allows users to save, reuse, and switch between different grid layouts for the Live Daily Physical Position view. This is especially useful for users who frequently analyze projected positions from different perspectives, such as pipeline-level, location-level, or instrument-level views.
Note
The View as Layout Configuration section controls how data is displayed, not which data is loaded.
| Field | Description |
|---|---|
| View as Layout Configuration | Enables layout configuration mode for the physical position grid. When enabled, users can define and save a custom layout based on column selection, grouping, sorting, and expansion levels. |
| Layout Name | Name assigned to the layout configuration. This name is used to identify the saved layout for future selection. Layout names should be meaningful (for example, Pipeline–Location Daily View). |
| Public / Private | Determines layout visibility. Private layouts are visible only to the logged-in user. Public layouts are available to all users with access to the screen. |
| Save Layout (icon) | Saves the current grid configuration (columns, grouping, sorting, and hierarchy state) under the specified layout name. |
| Select Layout | Dropdown used to select and apply an existing saved layout. When selected, the grid immediately refreshes to reflect the chosen configuration. |
Layouts do not save query filters such as pipeline, month, or volume type. Those must be selected each time in the Physical Position Query section.
After selecting the required criteria, click Load Position Data.
Step 3: Verifying the projected position
The Live Daily Physical Position section displays projected positions in a pivot-style grid, organized by pipeline, location, instrument, and date. Users can expand or collapse hierarchies to move between pipeline-level, location-level, and instrument-level views.
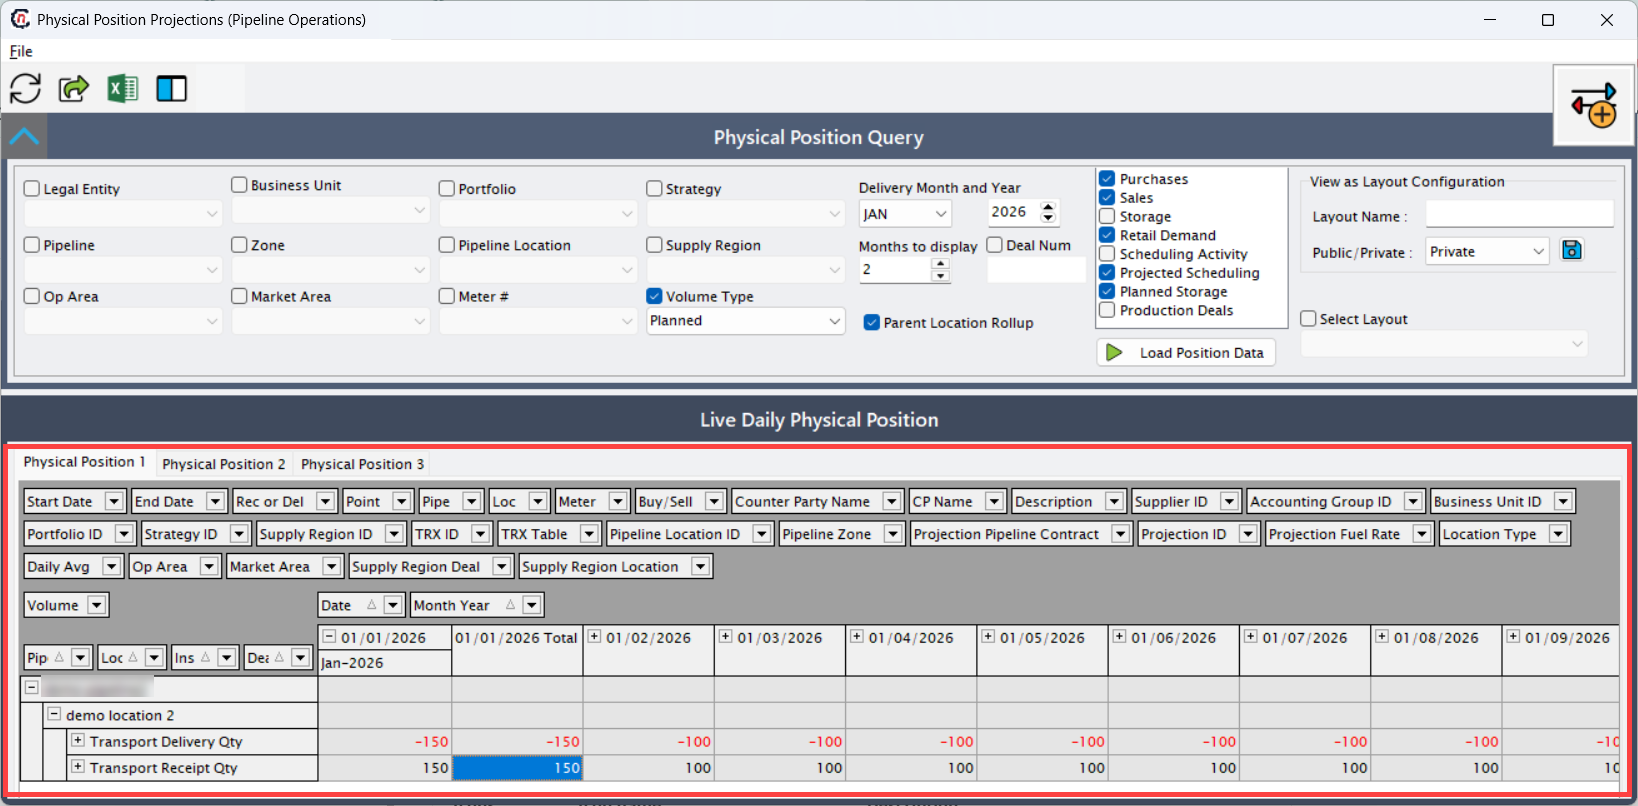
Multiple tabs (Physical Position 1, Physical Position 2, Physical Position 3) allow users to save and switch between different layout configurations.
Date and position fields
| Field | Description |
|---|---|
| Start Date | |
| End Date | The end gas day of the transaction or projection. |
| Date | Individual gas day for which the projected volume is displayed. |
| Month Year | Month-level aggregation of projected volumes for reporting and planning. |
| Rec or Del | Indicates whether the volume represents a receipt (R) into the system or a delivery (D) out of the system. |
| Buy/Sell | Indicates whether the position originates from a buy (supply) or sell (demand) transaction. |
| Volume | The projected volume for the selected date and position component. |
| Daily Avg | Displays the average daily volume across the selected date range. |
| Pipeline | Name of the pipeline associated with the projected position. |
| Pipe | Short pipeline code used for identification and grouping. |
| Location | Name of the pipeline location where the volume is received or delivered. |
| Loc | Short code or identifier for the pipeline location. |
| Location Type | Identifies whether the location is a receipt point, delivery point, storage point, or interconnect. |
| Meter | Meter associated with the physical flow at the location, if applicable. |
| Point | Contractual or operational point name used in the deal or pipeline contract. |
| Pipeline Location ID | Internal system identifier for the pipeline location record. |
| Pipeline Zone | Zone associated with the pipeline location, used for zonal balancing and constraints. |
| Supply Region ID | Identifier of the supply region contributing to the position. |
| Supply Region Deal | Supply region associated with the originating deal. |
| Supply Region Location | Supply region associated with the pipeline location. |
| Op Area | Operational area responsible for managing the location or flow. |
| Market Area | Downstream market area impacted by the projected delivery. |
| Instrument | Instrument type contributing to the position (e.g., Transport Receipt Qty, Transport Delivery Qty). |
| Description | Descriptive text from the underlying deal, contract, or transaction. |
| Counter Party Name | Full legal name of the counterparty associated with the transaction. |
| CP Name | Short name or abbreviation of the counterparty. |
| Supplier ID | Identifier of the supplying entity for receipt-side positions. |
| Accounting Group ID | Accounting group used for financial and reporting alignment. |
| Business Unit ID | Business unit responsible for the position. |
| Portfolio ID | Portfolio under which the transaction or projection is booked. |
| Strategy ID | Strategy associated with the projected position. |
| Deal ID | Identifier of the originating purchase, sale, or storage deal. |
| TRX ID | Unique transaction identifier for traceability across modules. |
| TRX Table | Source table from which the transaction data is derived. |
| Projection Pipeline Contract | Pipeline contract contributing to the projected position. |
| Projection ID | Unique identifier for the projection record generated by the system. |
| Projection Fuel Rate | Fuel retention rate applied during projection calculations. |
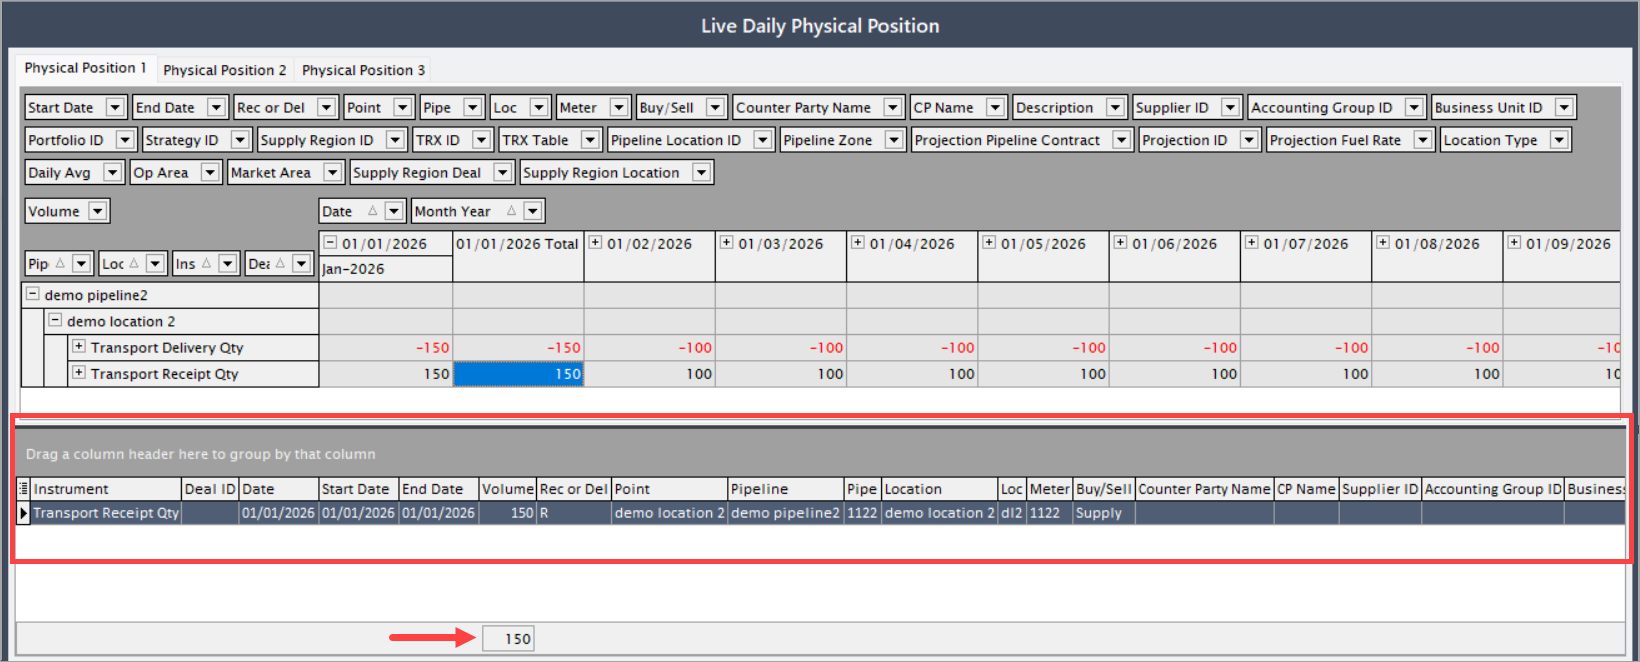
Transaction-level detail grid
The lower grid displays transaction-level detail for the selected date and position. This grid allows users to drill down from aggregated projections to the exact source transactions, including:
- Purchase and sales deal records
- Storage injection and withdrawal transactions
- Scheduling and projected scheduling nominations
- Pipeline contracts, locations, and meters
This ensures full data lineage, transparency, and auditability, enabling users to quickly investigate discrepancies, validate assumptions, and support operational decision-making.
Key points
- This screen displays projected, not settled, physical positions.
- Data is aggregated from multiple upstream nGenue modules.
- Filters allow granular control over pipeline, location, and organizational scope.
- Daily projections help identify imbalances before execution.
- Transaction-level drilldown ensures full traceability.
Summary
The Physical Position Projections screen provides a comprehensive, forward-looking view of expected physical gas positions across pipelines and locations. By consolidating planned, scheduled, and projected volumes from multiple sources, it enables operational and trading teams to proactively manage supply-demand balance, identify risks, and support informed decision-making across pipeline operations.