Viewing index curve values
An Index curve value represents market-based pricing information, either externally published or internally maintained, used to determine commodity prices for a specific location, pipeline, product, or time period. These values provide the foundational inputs for price calculations across billing, settlements, forecasting, and risk management processes.
Index curve values are applied whenever transactions, contracts, or settlements depend on variable pricing linked to market indices. They are referenced across multiple system modules, including pricing, billing, and settlements, to calculate payments, accruals, mark-to-market valuations, and exposure.
Configuration of index and curve definitions is managed within the Index/Curve definition screen. Once defined, index values are periodically updated, either manually entered or automatically refreshed through imported market data feeds, to ensure alignment with current market conditions.
Prerequisites
Before working on the Index/Curve value (Pricing) screen, ensure the following prerequisites are met:
- Ensure the nGenue application is installed and use valid login credentials to log into the application.
- Configure the user permissions including User type, Security user, Security group, Security assign user, and Security assign permissions in their respective screens to enable access to the Index/Curve value (Pricing) screen.
- Ensure the Local Distribution Company (LDC), Pipeline, and Index curve definition are properly configured.
Procedure to view index curve value
Step 1: Navigate to Index/Curve values (Pricing) screen
- Log in to the nGenue application.
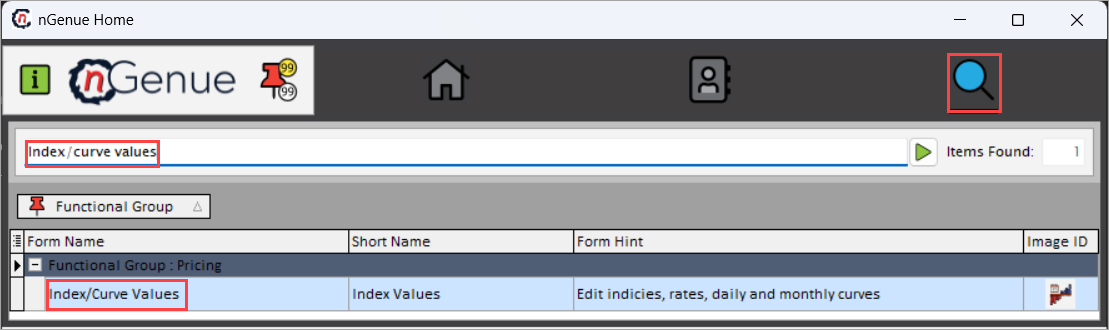
- Click the Search icon and enter the Index curve values in the search bar.
- Double-click the Index curve values from the search result to open the respective screen.
-
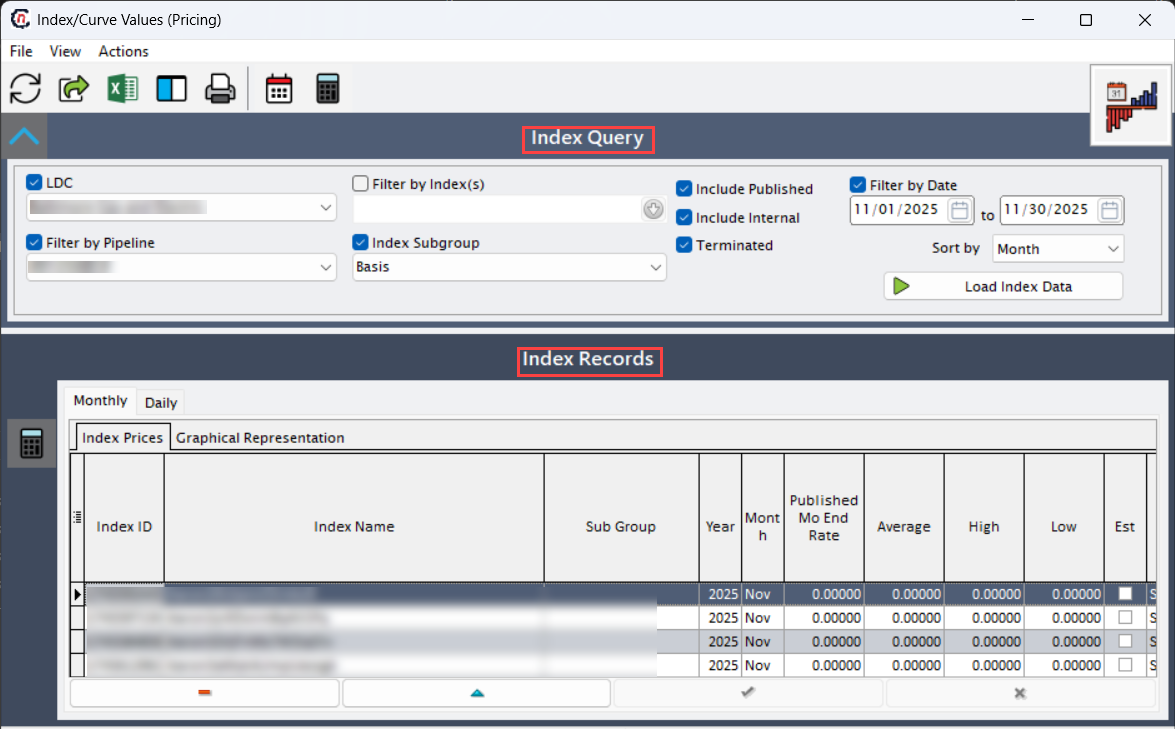
Index/Curve value (Pricing) screen has two sections:
- Index query: provides filterable fields to load index data
-
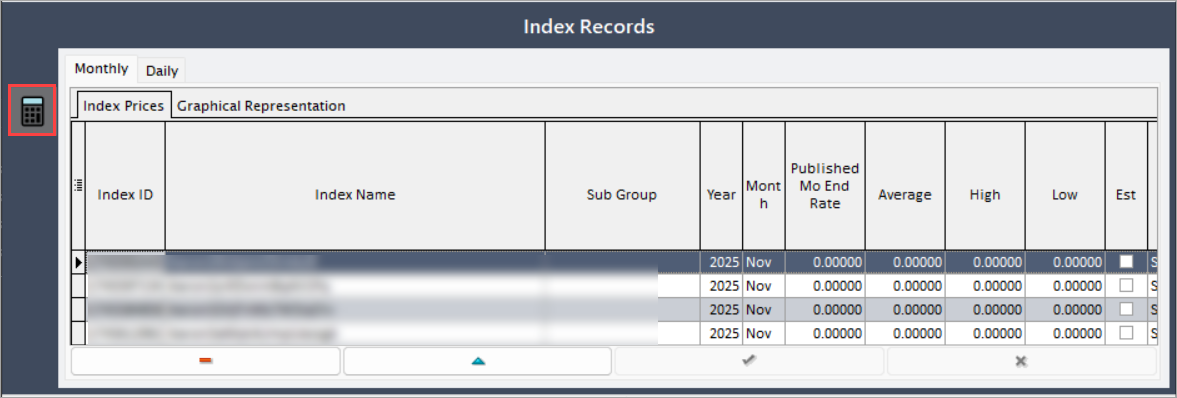
Index records: Displays monthly and daily index records.
- Monthly: Shows monthly averages, high/low, and published values.
- Daily: Displays individual daily rates or settlements.
Step 2: Load index data
-
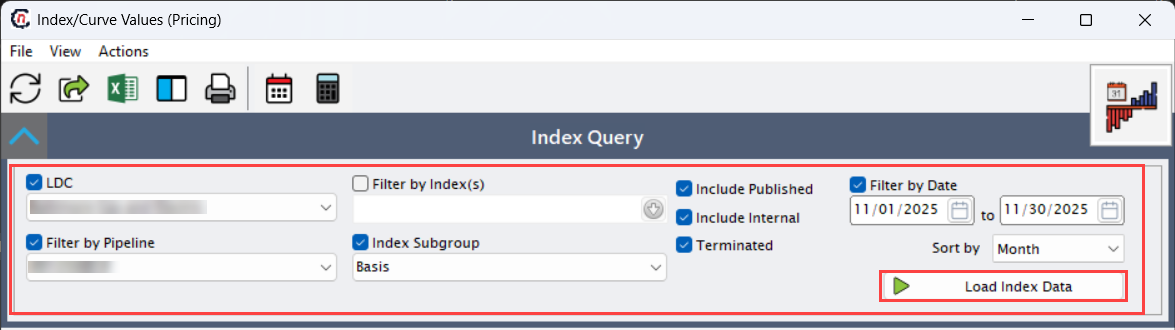
Enable and select the required fields available in the Index query section to execute the query and fetch the relevant index data.
Fields Description LDC Selects the Local Distribution Company for which index data is to be retrieved. Filter by pipeline Filters the index records by pipeline or transport path. Filter by index (s) Selects one or more indices to include in the query. Index subgroup Groups or classifies indices under related categories. Include published Includes officially published external index values. Include internal Includes internally calculated or adjusted index values. Terminated Includes historical or terminated index records in the results. Filter by date Limits the data retrieval to a specific date range. Sort by Defines the sorting order of the displayed results. -
Click Load index data to fetch the relevant index data as per selected criteria.
Step 3: View and manage Index records
-
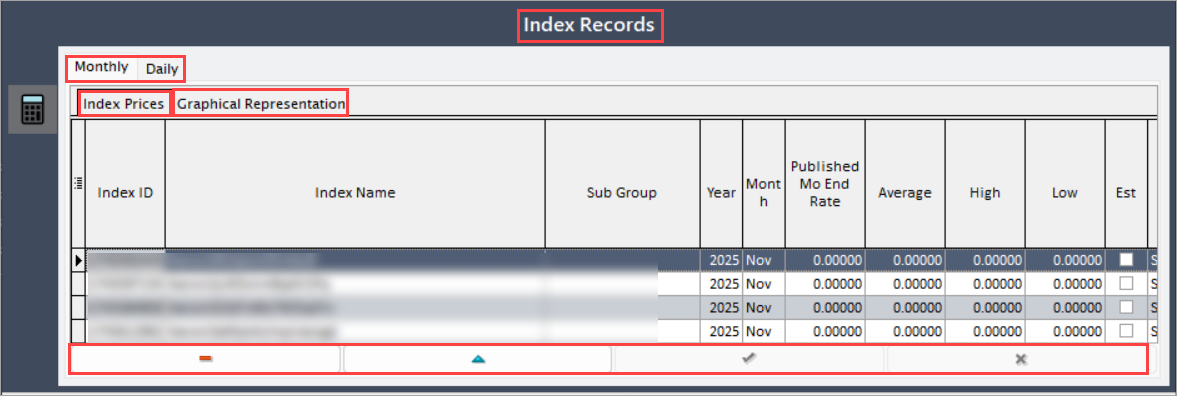
Once the query is executed, the index data will be displayed under the Index records section:
- The Index prices tab shows tabular data for monthly and daily indices.
- The Graphical representation tab displays these data points in a customizable line or bar chart for visual comparison.
-
The table below lists the fields that define each index record:
Fields Description Index ID Unique system-generated identifier for the index. Index name Official name of the market index. Subgroup Classification group associated with the index. Year Calendar year of the index record. Month Applicable calendar month. Published Mo End rate End-of-month published index rate. Average Monthly average index value. High Highest reported value for the period. Low Lowest reported value for the period. Est Estimated value for future or incomplete data periods. Value source note Notes specifying data origin or feed source. Use for market Indicates whether the index is used for market pricing. Use for supply Indicates whether the index is used for supply or cost reference. Index comments entered notes or contextual comments. Active Indicates if the index record is active. Index type Defines the index type. Feed ID 1 Identifiers for data feed sources. Feed ID 2 Identifiers for data feed sources. Report name Name of the report or data source from which index values were imported. Last updated by User who last modified the index record. Last updated on Timestamp of the last update. Composite Shows if the index includes NYMEX-linked pricing components. Includes NYMEX Specifies the source where the activity logged from. Basis Represents the differential between two related indices. Cashout Reflects the final settlement adjustment rate. Effective Effective start date of the index record. End date End date for which the index record is valid. Month year Combined display of month and year for quick reference. -
To manage index data, select the record and click Edit record to modify the record, click Delete record to remove the record and Post edit to save the changes, Cancel edit to discard the changes.
-
Click the Calculate daily index averages to automatically compute average index rates based on daily values within the selected month.
Summary
The Index curve values screen enables users to query, review, and manage market index data that drives pricing, settlements, and financial forecasting. Accurate configuration and periodic review of index values ensure precise billing calculations and alignment with market fluctuations.