EDI integration dashboard
The EDI integration dashboard provides a centralized interface to monitor, analyze, and troubleshoot Electronic Data Interchange (EDI) processes across the system.
It consolidates operational metrics, visualizes integration trends, highlights processing errors, and enables configuration of EDI settings for seamless data exchange.
This document explains how to navigate and use the features of the EDI integration dashboard, including dashboard views, LDC-specific EDI data, configuration screens, charts, and filtering options.
Prerequisites
Before using the EDI integration dashboard screen, ensure the following prerequisites are met:
- Ensure the nGenue application is installed and use valid login credentials to log into the application.
- User permissions: Must configure security settings including User type, Security user, Security group, Security assign user, and Security assign permissions in their respective screens to ensure required access for EDi integration dashboard actions.
- Configure LDC configuration to support LDC EDI processing.
- Set up API integration if EDI workflows require API communication.
Procedure to configure EDI integration dashboard
- Log in to the nGenue application.
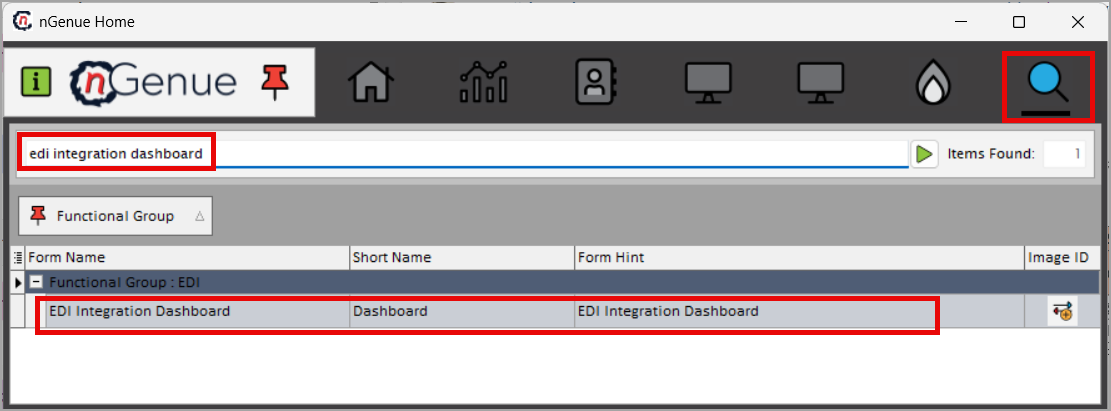
- Click the Search icon and enter
edi integration dashboard. -
Double-click EDI integration dashboard to open the screen.
-
View the following tabs:
- Dashboard: Displays a visual summary of EDI integration activity.
- LDC EDI: Shows detailed LDC-specific EDI task, error, and processing data.
-
Configuration: Allows loading and reviewing EDI integration and import configuration settings.
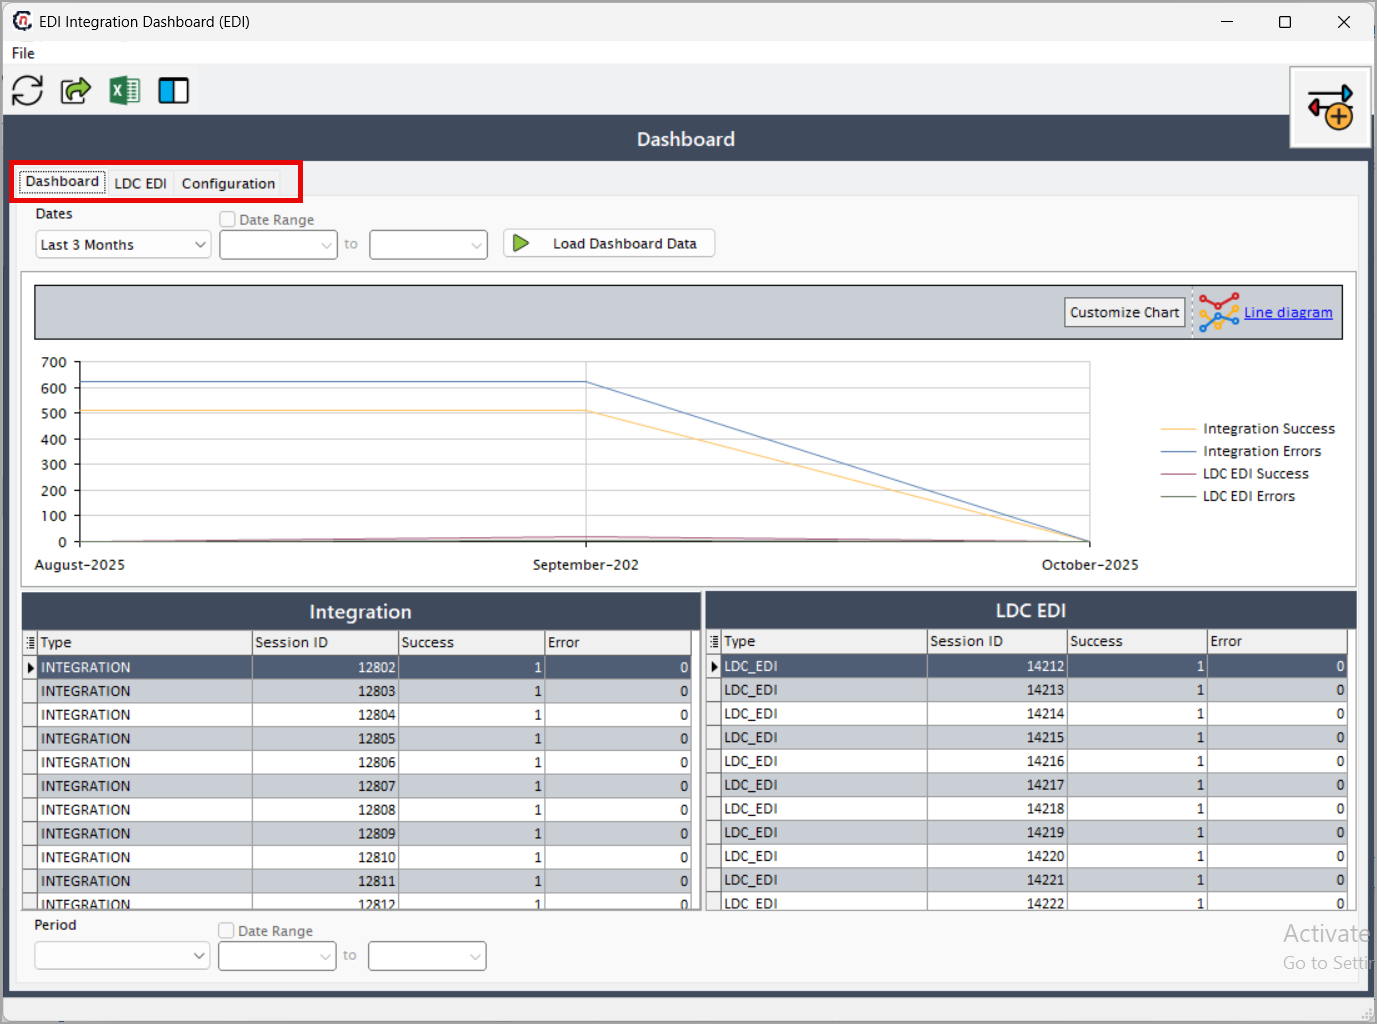
Dashboard tab
The Dashboard tab displays charts, metrics, and summary tables for EDI processes. It includes:
- Chart visualization: Provides a graphical view of integration success, errors, and LDC EDI trends.
- Integration: Lists integration sessions with success and error counts.
-
LDC EDI: Shows LDC EDI session results including processed and failed counts.
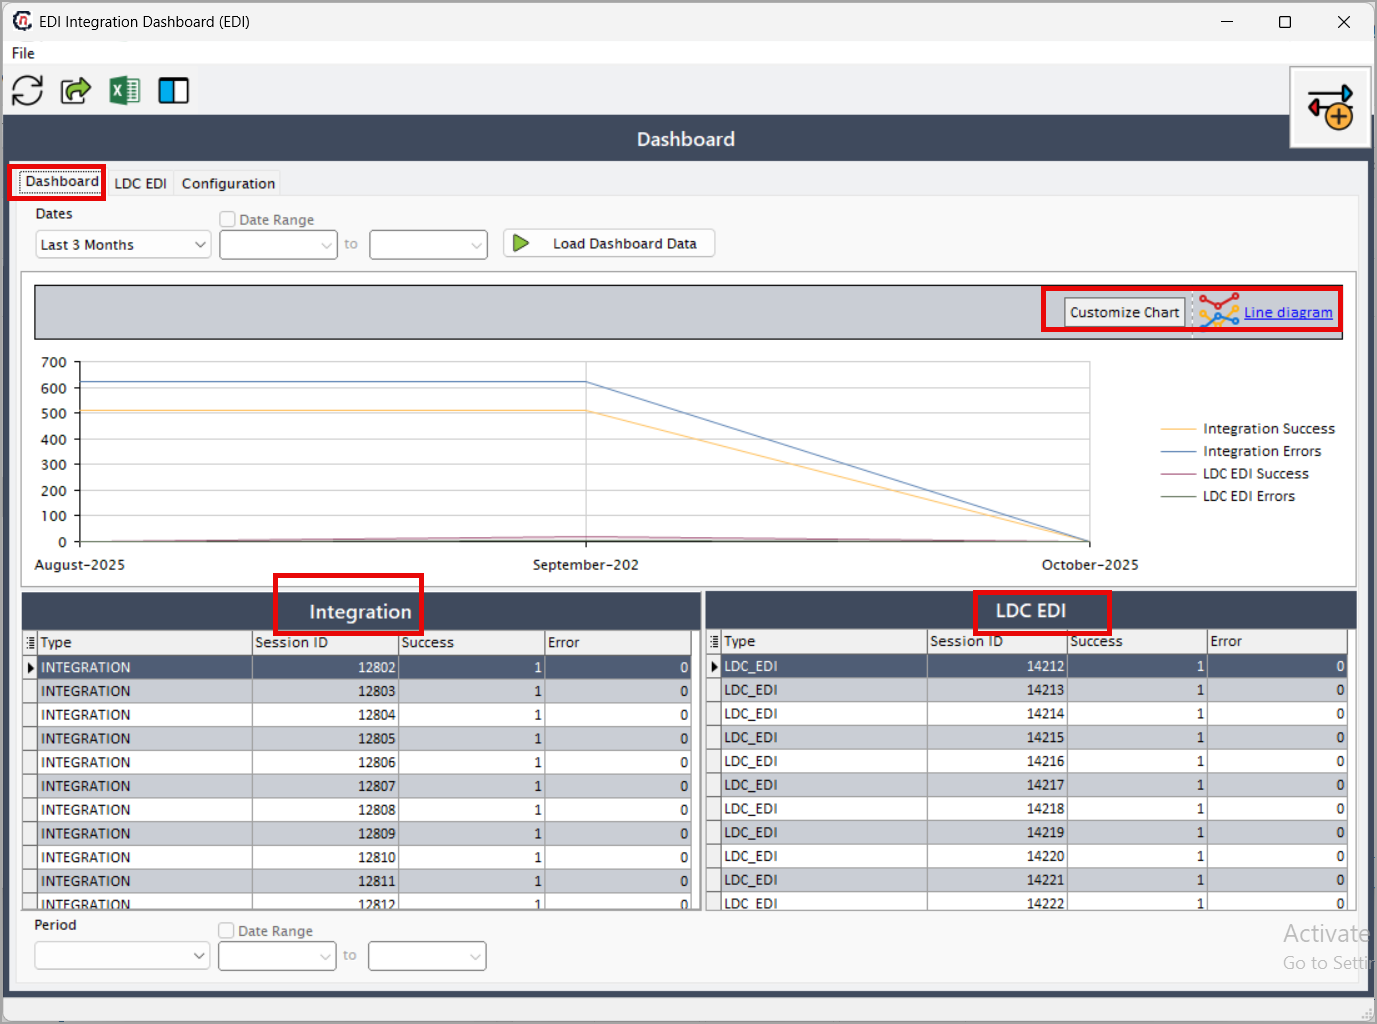
Chart visualization
The dashboard displays a line diagram showing the following metrics:
| Metric | Description |
|---|---|
| Integration success | Number of successfully processed integration records (orange line). |
| Integration errors | Number of failed integration records (blue line). |
| LDC EDI success | Number of successfully processed LDC EDI records (red line). |
| LDC EDI errors | Number of failed or erroneous LDC EDI records (black line). |
Customization options
- Customize chart: Change colors, date ranges, chart types, or display settings.
- Line diagram: Reload the default chart view.
Integration table
The left-side table displays integration-related details.
| Column | Description |
|---|---|
| Type | Integration process type. |
| Session ID | Unique session identifier. |
| Success | Number of successfully processed records. |
| Error | Number of failed records. |
Note
When no data matches the filters, the system displays “No data to display.”
LDC EDI table
The right-side table displays LDC-specific EDI details.
| Column | Description |
|---|---|
| Type | LDC EDI process type. |
| Session ID | Unique session identifier. |
| Success | Number of successfully processed LDC EDI items. |
| Error | Number of failed LDC EDI items. |
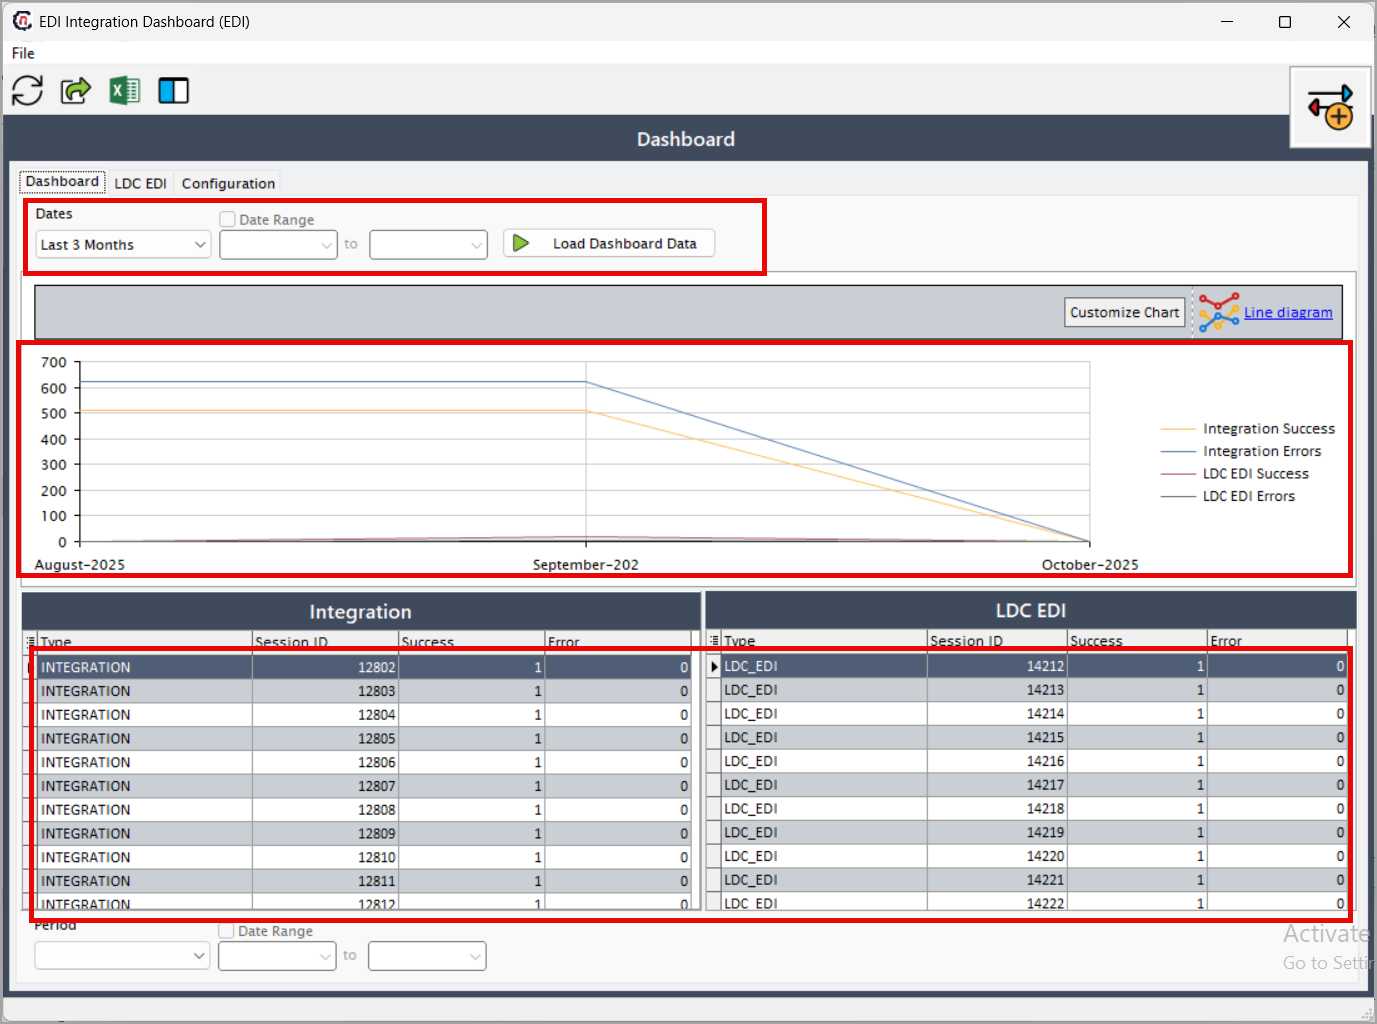
General steps to use Dashboard tab
- Select a dates.
- Click Load dashboard data.
- Review the Chart visualization.
- Analyze the Integration and LDC EDI tables.
-
Use Customize chart to adjust the chart appearance.
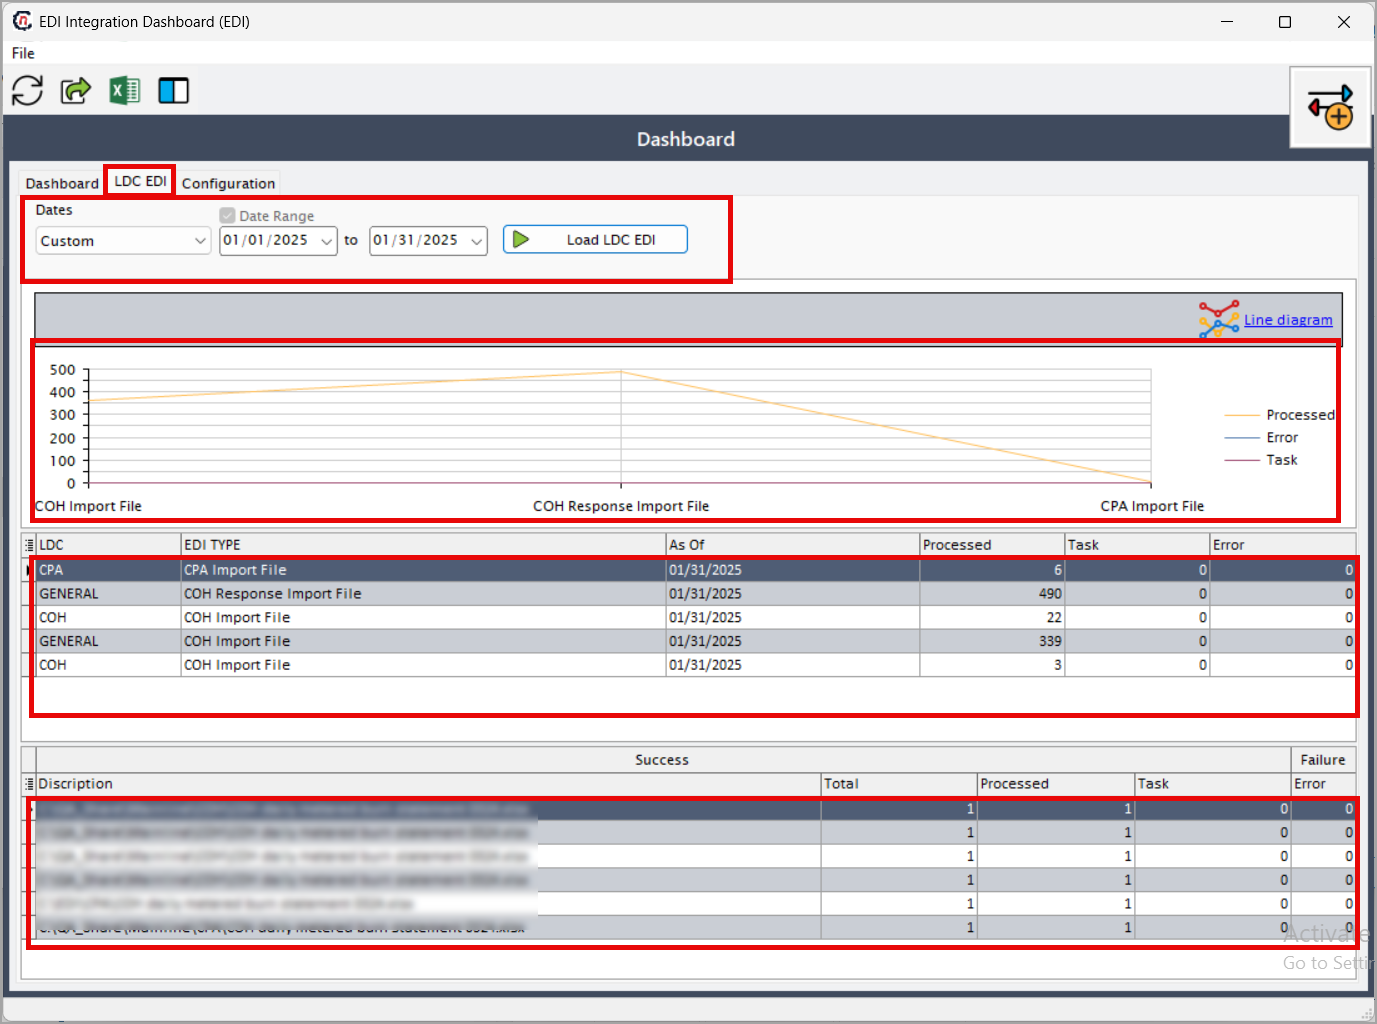
LDC EDI tab
The LDC EDI tab displays detailed LDC-specific EDI activity including processed records, tasks, and errors.
Step 1: Load LDC EDI data
- Select a date range.
- Choose a predefined or custom date range.
- Enter the start date and end date.
- Click Load LDC EDI.
Expected result
- The system displays LDC EDI processed counts, tasks, and errors.
- The chart shows trends for processed, tasks, and error counts.
- Two tables display detailed task and file-level data.
LDC EDI tab structure
Top chart
Displays processed records, tasks, and errors for the selected date range.
Upper table
| Column | Description |
|---|---|
| LDC | Local distribution company. |
| EDI type | Incoming EDI process type. |
| Processed | Number of processed records. |
| As of | Timestamp for the latest update. |
| Task | Task count. |
| Error | Error count. |
Lower table
| Column | Description |
|---|---|
| Description | Description of the file or batch. |
| Total | Total records in the file. |
| Processed | Number of processed records. |
| Task | Task details. |
| Error | Number of errors found in the file. |
Step 2: Change chart type
- Click the Line diagram button.
-
Select a chart type:
- Area diagram
- Bar diagram
- Column diagram
- Line diagram
- Pie diagram
- Stacked area diagram
- Stacked bars diagram
-
Stacked columns diagram
Note
The chart updates immediately when you select a new type.
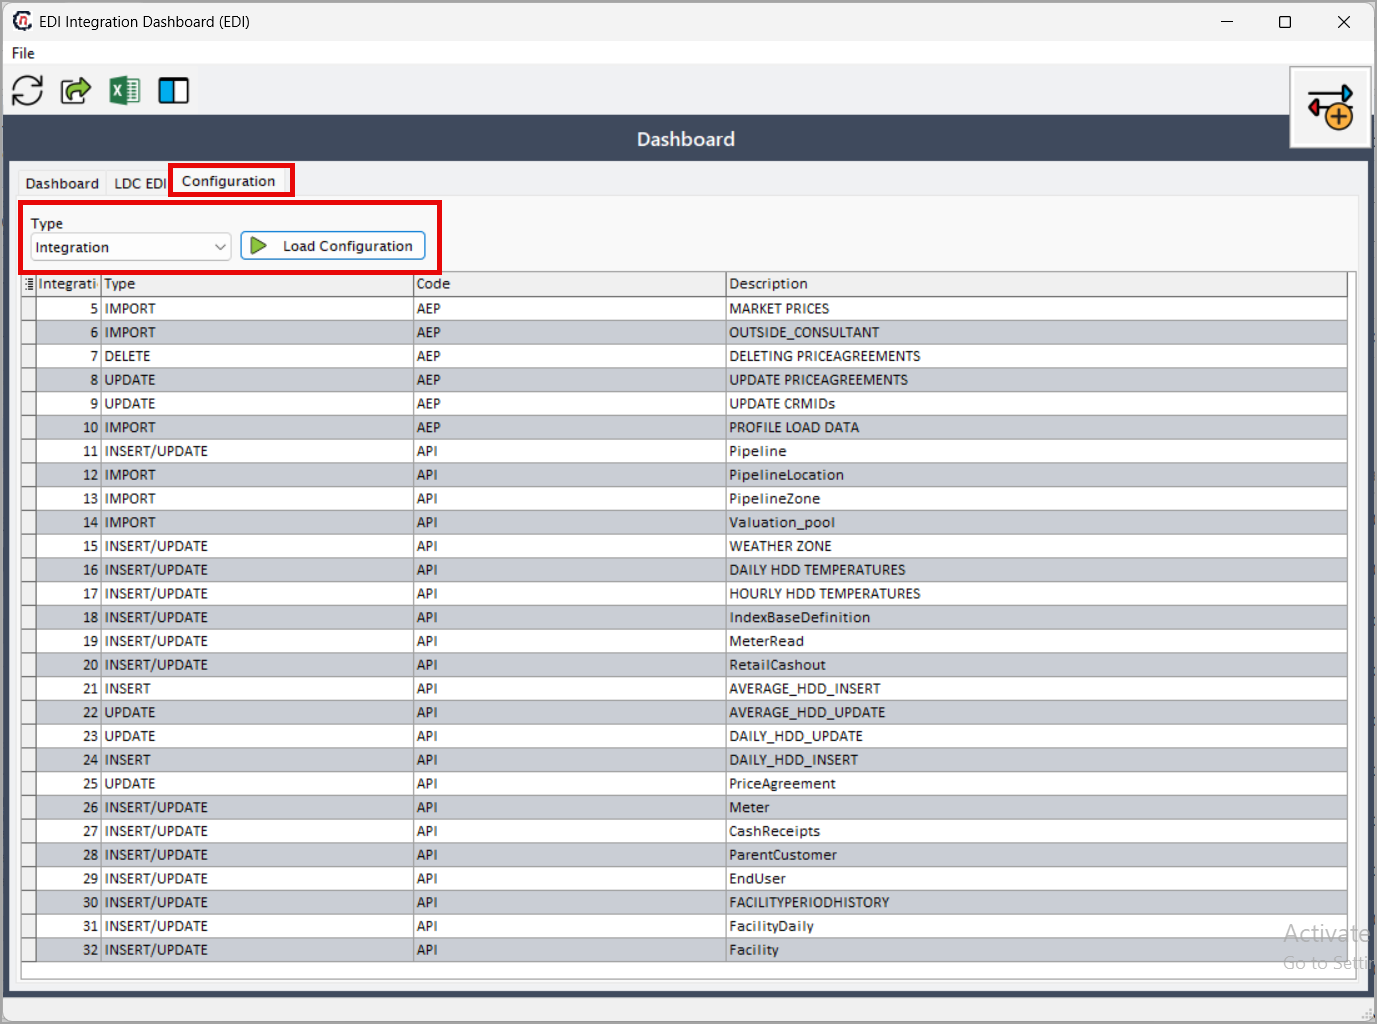
Configuration tab
The Configuration tab displays EDI integration and import configuration details.
Step 1: Select configuration type
Select a type from the Type dropdown:
- Integration
- Import
Step 2: Load configuration
- Click Load configuration.
-
The system loads and displays configuration data in the table.
Summary
The EDI integration dashboard provides complete visibility into EDI workflows by allowing users to monitor integration and LDC EDI performance, visualize data trends through customizable charts, review success, task, and error metrics, load integration and import configuration settings, and troubleshoot data issues using session-level insights, helping streamline EDI processes, improve accuracy, and support effective decision-making across the organization.