Facility daily volume analysis
The Facility Daily Volume Analysis screen is used to review, analyze, and compare daily gas consumption volumes at the facility and end-user level within an LDC and pipeline context. It provides a detailed, date-driven view of actual, estimated, and nominated volumes, enabling users to evaluate usage trends, validate load profiles, and support operational and settlement decisions.
This screen is primarily used by volume management, operations, and forecasting teams to:
- Review daily facility-level gas consumption.
- Compare actual usage against estimates and nominations.
- Analyze historical usage trends over a selected date range.
- Support load profile validation and forecasting accuracy.
- Identify anomalies or deviations in daily consumption patterns.
Prerequisites
Before working with the Facility Daily Volume Analysis screen, ensure the following prerequisites are met:
- The user has the add or modify permissions for the Facility Daily Volume Analysis screen.
- The LDC is configured and active in nGenue.
- Facilities and end users are defined and associated with the LDC.
- Daily usage data (actual or estimated) is available for the selected period.
- Load profiles and nomination data exist where comparison is required.
Procedure to review facility daily volume analysis
Step 1: Navigate to the Facility Daily Volume Analysis screen
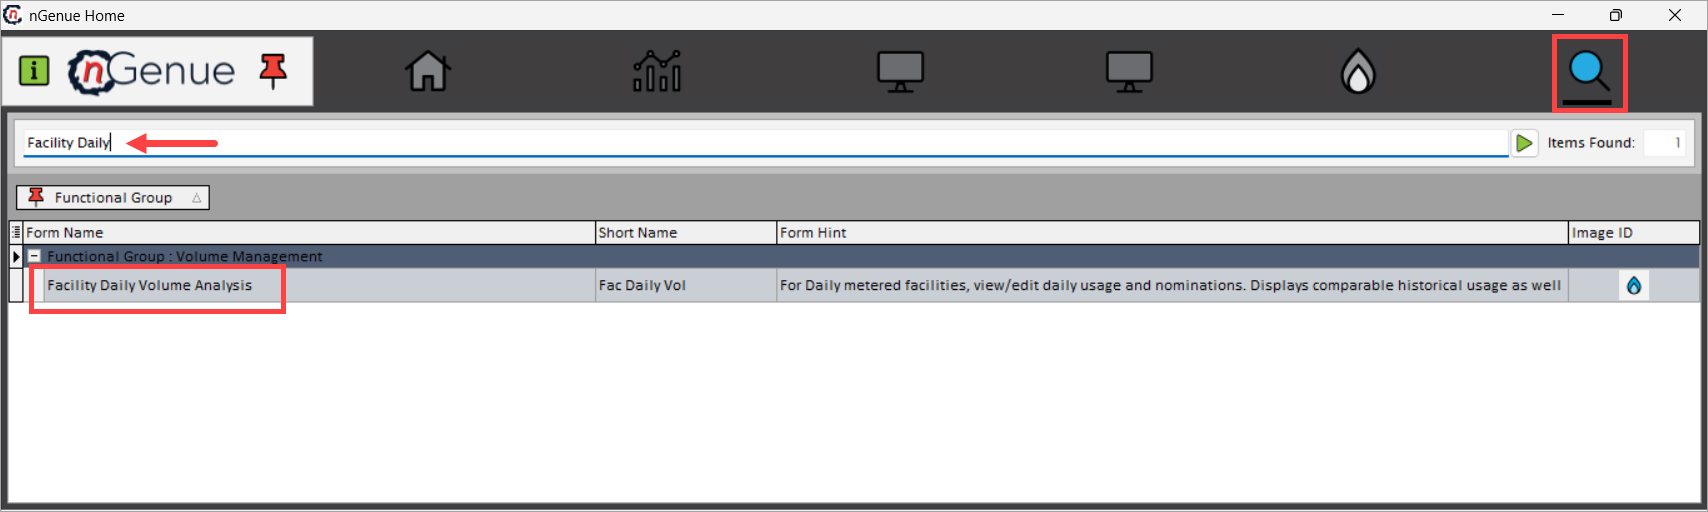
- Log in to the nGenue application.
- Click the Search icon and enter Facility Daily in the search bar.
-
Double-click Facility Daily Volume Analysis to open the Facility Daily Volume Analysis (Volume Management) screen.
-
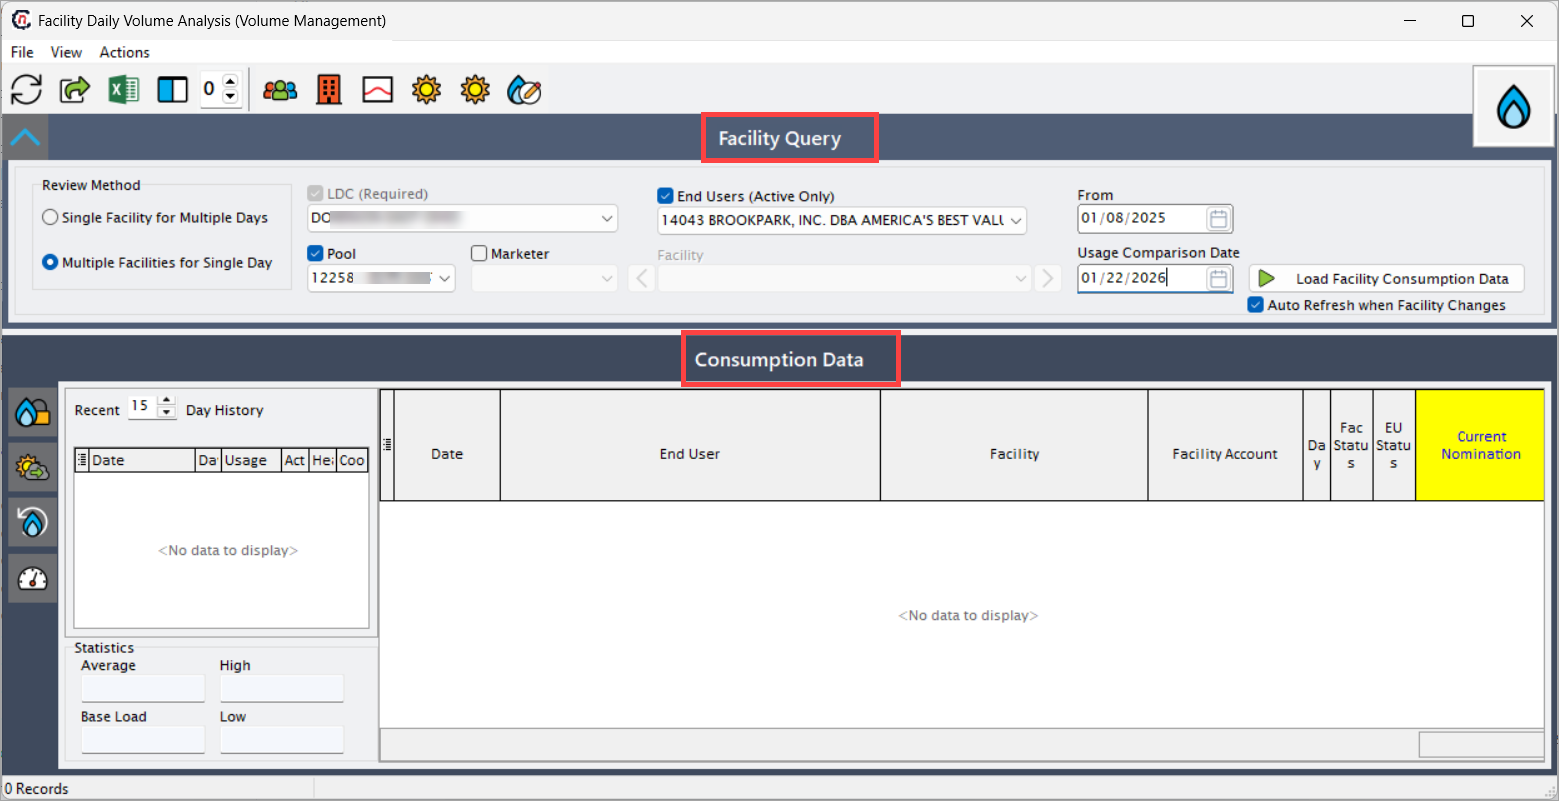
The screen is divided into the following primary sections:
- Facility Query- used to define filtering and selection criteria.
- Consumption Data- – displays daily usage and nomination details in a grid.
- Statistics and history panels– provide supporting analytical insights and historical context.
Step 2: Define facility query criteria
The Facility Query section controls which facility consumption data is loaded.
| Fields | Description |
|---|---|
| Review Method | Select whether to analyze a single facility across multiple days or multiple facilities for a single day, depending on whether the focus is trend analysis or cross-facility comparison. |
| LDC (Required) | Select the Local Distribution Company for which facility usage data should be reviewed. This is mandatory as all facilities are tied to an LDC. |
| Pool | Select the pool associated with the facilities. This limits results to facilities mapped to the selected pool and helps narrow large datasets. |
| End Users (Active Only) | Select an active end user to restrict results to facilities associated with that end user, reducing irrelevant data. |
| Marketer | Optionally filter results by marketer to analyze consumption related to a specific commercial relationship. |
| Facility | Select a specific facility when reviewing a single facility, enabling focused day-by-day analysis. |
| From Date | Enter the start date for which daily usage should be reviewed. This determines the beginning of the analysis period. |
| Usage Comparison Date | Enter a comparison date used to analyze usage variance between periods, helping identify changes in consumption behavior. |
| Auto Refresh when Facility Changes | Automatically refreshes consumption data when a different facility is selected, ensuring the grid always reflects the latest selection. |
After defining the required criteria, click Load Facility Consumption Data to retrieve results.
Step 3: Review consumption data
The Consumption Data section displays daily facility usage in a detailed grid format.
This section provides a consolidated view of:
- Actual usage volumes
- Estimated usage volumes
- Daily nomination values
- Facility and end-user associations
-
Status indicators for facilities and end users
Fields Description Date Gas day for which usage data is displayed, allowing precise daily analysis. End User End user associated with the facility for the selected date, providing customer-level context. Facility Facility where gas consumption occurred, representing the physical delivery point. Facility Account Account associated with the facility and end user, used for tracking and settlement purposes. Daily Usage Actual or estimated gas consumption for the facility on the selected date, expressed in standard volume units. Facility Status Indicates whether the facility is active for the selected date, helping identify inactive or terminated facilities. End User Status Indicates whether the end user is active for the selected date, ensuring usage is tied to valid entities. Current Nomination Displays the nominated volume associated with the facility for the gas day, enabling direct comparison with usage to identify variances.
This grid supports daily-level analysis, allowing users to quickly identify usage spikes, drops, or inconsistencies.
Step 4: Review day history and statistics
The left-side panels provide supporting analytical context.
Day history panel
The Day History panel displays recent historical usage records for the selected facility, enabling quick review of short-term consumption trends.
Users can control the number of historical days displayed using the Recent Days selector.
Statistics panel
The Statistics panel provides calculated usage metrics for the selected facility and date range.
| Fields | Description |
|---|---|
| Average | Average daily usage calculated over the displayed period. |
| High | Highest recorded daily usage within the selected period. |
| Low | Lowest recorded daily usage within the selected period. |
| Base Load | Represents the baseline or minimum expected daily usage for the facility. |
These values help validate load profiles and assess consistency in facility consumption behavior.
Key points
- The LDC selection is mandatory to load facility consumption data.
- The screen supports both single-facility and multi-facility analysis modes.
- Daily usage values may represent actual or estimated volumes depending on data availability.
- Current Nomination values allow direct comparison between scheduled and consumed volumes.
- Statistical summaries assist in validating load profiles and identifying anomalies.
Summary
The Facility Daily Volume Analysis screen provides a detailed, date-driven view of gas consumption at the facility and end-user level. By consolidating daily usage, nomination data, and historical statistics into a single analytical interface, it enables volume management and operations teams to validate load profiles, monitor consumption trends, and support accurate forecasting and settlement workflows.