Review actual weather history
The Actual Weather History screen is used to view, import, and analyze daily actual weather data for a selected weather zone over a defined date range. This screen captures real, observed weather values such as temperature highs and lows, heating and cooling degree days, wind speed, and heat index, which are critical inputs for load profile calculations, usage forecasting, and operational analysis.
This screen is primarily used to validate weather-driven demand patterns and ensure that downstream load and consumption calculations are based on accurate historical weather data.
The Actual Weather History screen enables users to:
- Review daily actual weather observations by zone.
- Import externally sourced weather data files.
- Analyze heating and cooling degree days (HDD/CDD).
- Compare actual weather against historical averages.
- Support load profile, forecast, and usage calculations.
Prerequisites
Before reviewing the Actual Weather History screen, ensure the following prerequisites are met:
- Weather zones are configured and active in nGenue.
- The user has view or modify permissions for the Actual Weather History screen.
- External weather data files are available (if importing data).
- Date ranges selected align with supported historical periods.
Procedure to review actual weather history
Step 1: Navigate to the Actual Weather History screen
- Log in to the nGenue application.
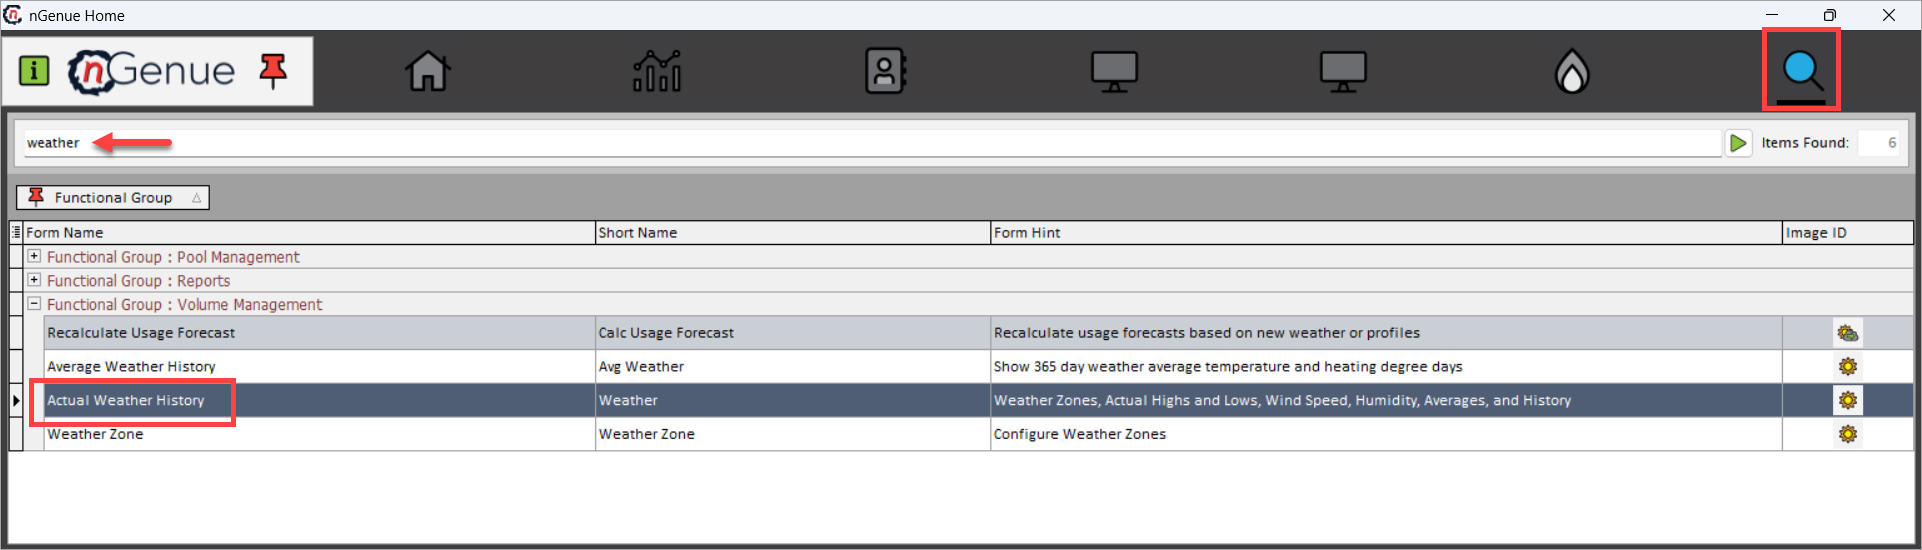
- Click the Search icon and enter Actual Weather in the search bar.
- Double-click Actual Weather History to open the Actual Weather History (Volume Management) screen.
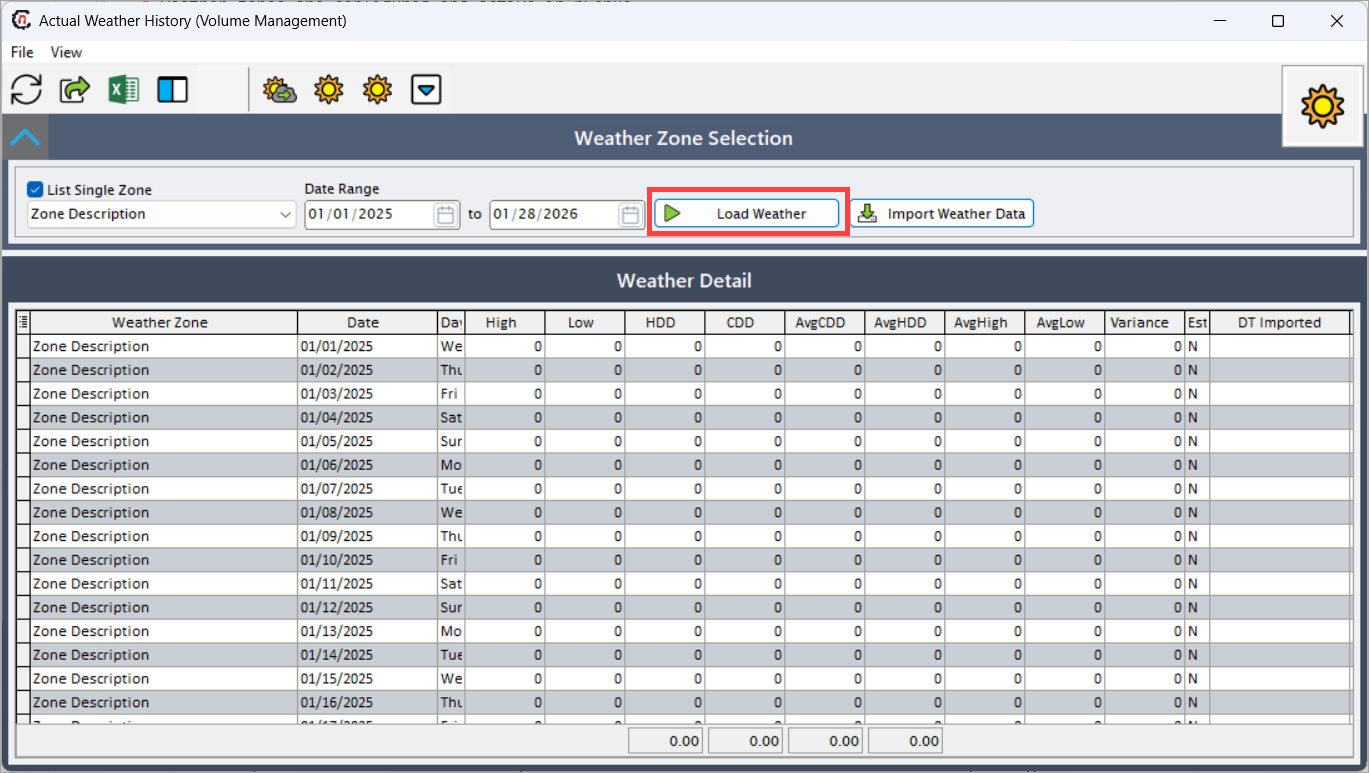
- The screen is divided into two main sections:
- Weather Zone Selection: This section controls which actual weather records are displayed.
- Weather Detail: This section displays daily actual weather records in a tabular format. Each row represents one calendar day of observed weather data for the selected weather zone.
Step 2: Select weather zone and date range
The Weather Zone Selection section controls which actual weather records are displayed.
| Fields | Description |
|---|---|
| List Single Zone | Select this option to view weather data for a single weather zone. |
| Weather Zone | Select the weather zone for which actual weather data is required. Weather zones typically represent geographic or climatic regions. |
| Date Range | Enter the start and end dates for which actual weather data should be retrieved. |
| Load Weather | Click to load actual weather data for the selected zone and date range. |
| Import Weather Data | Click to import actual weather data from an external file source into nGenue. |
Once the required criteria are selected, click Load Weather to retrieve the corresponding records.
Step 3: Review weather detail data
The Weather Detail section displays daily actual weather records in a tabular format. Each row represents one calendar day of observed weather data for the selected weather zone.
| Fields | Description |
|---|---|
| Weather Zone | Displays the selected weather zone associated with the weather record. |
| Date | Displays the calendar date for which weather data is recorded. |
| Day | Displays the day of the week corresponding to the date. |
| High | Displays the actual recorded high temperature for the day. |
| Low | Displays the actual recorded low temperature for the day. |
| HDD (Heating Degree Days) | Displays the number of heating degree days calculated based on the base temperature configured in the system. HDD values indicate heating demand. |
| CDD (Cooling Degree Days) | Displays the number of cooling degree days calculated for the day. CDD values indicate cooling demand. |
| AvgHDD | Displays the historical average heating degree days for the same calendar day, used for comparison. |
| AvgCDD | Displays the historical average cooling degree days for the same calendar day. |
| AvgHigh | Displays the historical average high temperature for the day. |
| AvgLow | Displays the historical average low temperature for the day. |
| Variance | Displays the difference between actual and average values, helping identify abnormal weather patterns. |
| Est | Indicates whether the weather data is estimated (Y) or actual (N). |
| DT Imported | Indicates whether the record was imported via an external data file. |
| File Date | Displays the file date associated with the imported weather data. |
| AM Wind Speed | Displays recorded morning wind speed values, if available. |
| PM Wind Speed | Displays recorded afternoon or evening wind speed values. |
| Low Wind Chill | Displays the lowest wind chill recorded for the day, if applicable. |
| High Heat Index | Displays the highest heat index recorded for the day. |
| Max Air Temp | Displays the maximum observed air temperature for the day. |
These values provide a comprehensive daily weather snapshot, which directly impacts load forecasting and usage modeling.
Key points
- Each record represents one day of actual observed weather.
- HDD and CDD values directly influence gas demand modeling.
- Imported data should be validated before use in load calculations.
- Variance fields help identify abnormal weather events.
- Actual weather history is a foundational input for load profiles and forecasts.
Summary
The Actual Weather History screen provides a detailed, day-level view of observed weather conditions by zone, serving as a critical input for gas demand forecasting and volume management. By allowing users to review and import actual weather data, the screen ensures that downstream calculations are grounded in accurate environmental conditions, improving planning, forecasting, and operational decision-making across nGenue.