Review location imbalances
A Location imbalance represents the difference between the total gas received into a specific pipeline location and the total gas delivered out of that location for a given gas day, month, or year. Location imbalances are measured at physical or logical locations such as city gates, pooling points, plant inlets, market zones, or storage interconnects.
Location imbalances arise when actual or scheduled receipts and deliveries at a location are not perfectly aligned. In nGenue, the Location imbalances (Pipeline operations) screen provides visibility into daily, monthly, and yearly imbalance positions at the location level, enabling operational and commercial teams to analyze, manage, and resolve imbalance risk.
Prerequisites
Before working on the Location imbalances (Pipeline operations) screen, ensure the following prerequisites are met:
- Ensure the nGenue application is installed and use valid login credentials to log into the application.
- Configure the user permissions including User type, Security user, Security group, Security assign user, and Security assign permissions in their respective screens to enable access to the Location imbalances (Pipeline operations) screen.
- Ensure that Pipeline, location and volume data is available for the selected date range.
Procedure to review daily imbalances
Step 1: Navigate to the Daily imbalances screen:
- Log in to nGenue application.
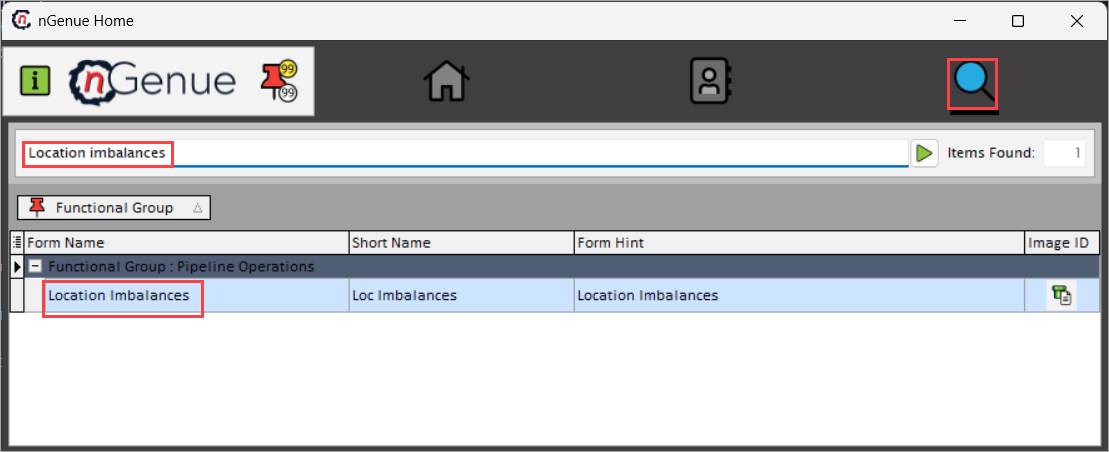
- Click Search icon and enter Location imbalances in the search bar.
-
Double-click Location imbalances to open the respective screen.
-
In Location imbalances (Pipeline operations) screen, there are two sections
-
Selection criteria: This section provides filterable fields necessary to define the scope of imbalance analysis.
- Yearly/monthly/daily imbalances: This section displays calculated imbalance results.

Step 2: Execute the query
-
Complete the fields available in the Imbalance query section to retrieve the imbalances data.
Fields Description Date range (to) Specify the start and end date for the imbalance analysis period. Pipeline Select the pipeline for which imbalances are reviewed. Pipeline location Select the pipeline location that acts as receipt or delivery point. Layout name Provide the name of a saved layout that defines which columns are displayed and how the results grid is arranged. Public/private Specify whether the selected layout is shared across users either to be Public or Private. Select layout Select the layout to refresh the imbalance results grid with chosen column configuration. -
Click Load imbalances to run the query to retrieve the data of location imbalances based on the selected criteria.
Step 3: Review imbalances
-
Once the imbalances are generated, results are displayed in the Yearly/monthly/daily imbalances section. Data fields provided in the following table can be rearranged dynamically using drag-and-drop functionality to organize the view.
Fields Description Day Specifies the gas day for which the imbalance is calculated. Year Specifies the calendar year associated with the imbalance record. Rec vol Indicates the total receipt volume at the location. Del vol Indicates the total delivery volume at the location. Cumul imbalances Displays the running cumulative imbalance position for the period. Imbalance Indicates the net difference between the receipt and delivery volumes. Cashout Indicates whether the imbalance is subject to cash-out settlement. Location Specifies the pipeline location where the imbalance occurred. Month Specifies the month associated with the imbalance record. Vol date Specifies the gas day or volume effective date. Grand total Indicates the aggregated imbalance total across the selected period. 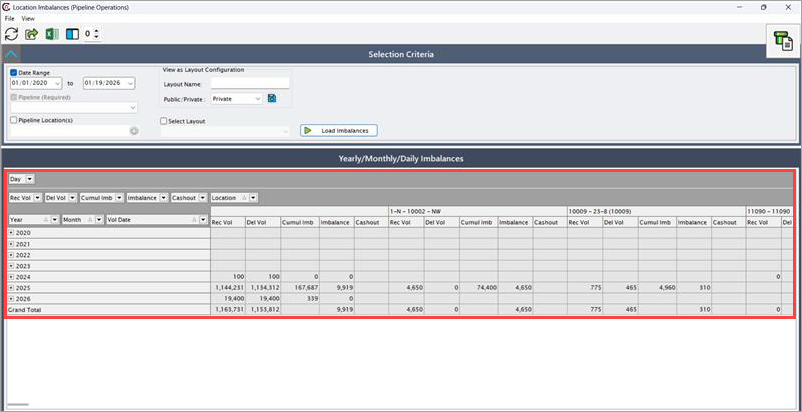
Summary
The Location imbalances (Pipeline operations) screen in nGenue provides critical visibility into receipt and delivery variances at the location level. By reviewing daily, monthly, and yearly imbalance positions, helps to manage operational risk, support accurate billing, and ensure reliable natural gas supply across the pipeline network.