Analyzing pipeline MDQ usage
The Pipeline MDQ Analysis screen is used to evaluate how much of a contract’s Maximum Daily Quantity (MDQ) has been consumed within a selected period and how much capacity remains available. It gives schedulers, operators, and contract analysts full visibility into:
- Daily MDQ consumption
- Nomination volumes applied against MDQ
- Remaining MDQ balance
- Contract-level constraint adherence
- Release quantities reducing available MDQ
- Net receipt and delivery volumes after fuel
It provides a consolidated perspective of MDQ utilization for operational decision-making.
Prerequisites
Before using the Pipeline MDQ Analysis screen, ensure the following prerequisites are met:
- The user have the add or modify permissions for the Pipeline MDQ Analysis screen.
- Transportation contracts are configured with assigned MDQ values. This is configured within the Pipeline Contract screen.
- Pipelines and related contract types are available in the system.
- Daily nominations and scheduled quantities have been entered or imported.
- Release records (e.g., capacity releases) exist if the contract allows MDQ release.
Procedure to analyze MDQ usage
Step 1: Navigate to the Pipeline MDQ Analysis screen
- Log in to nGenue.
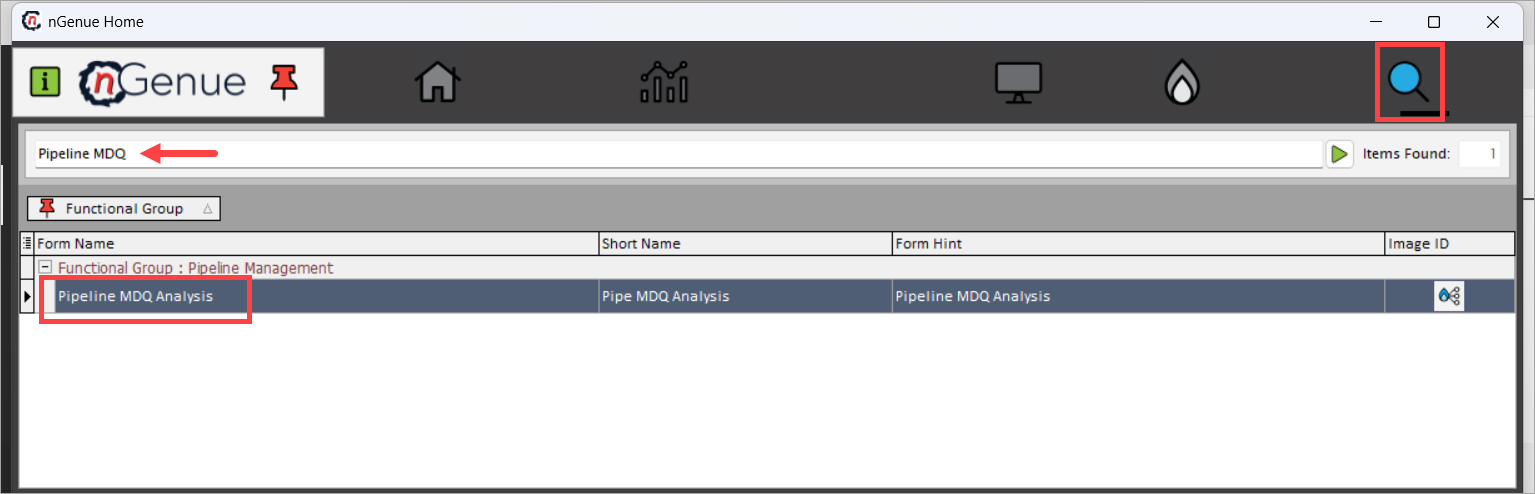
- Click the Search icon and enter Pipeline MDQ.
-
Double-click Pipeline MDQ Analysis to open the Pipeline MDQ Analysis (Pipeline Management) screen.
-
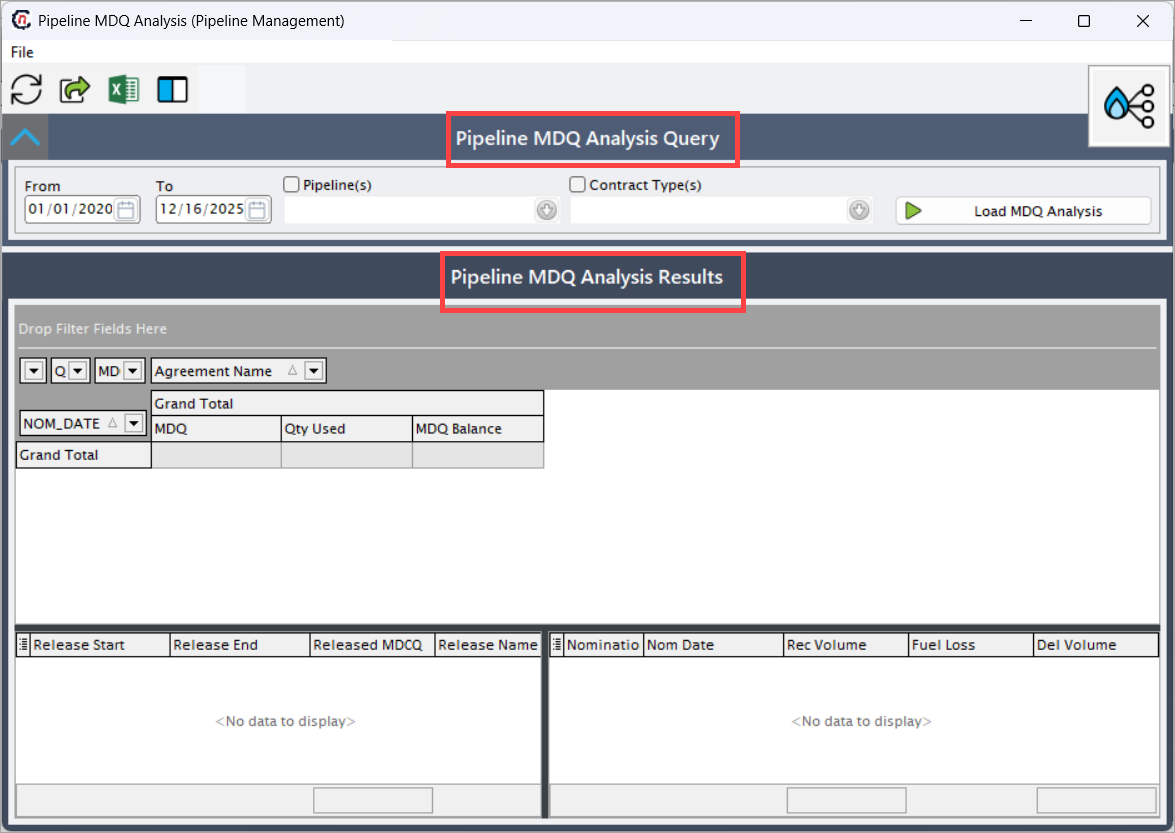
The screen is divided into two sections:
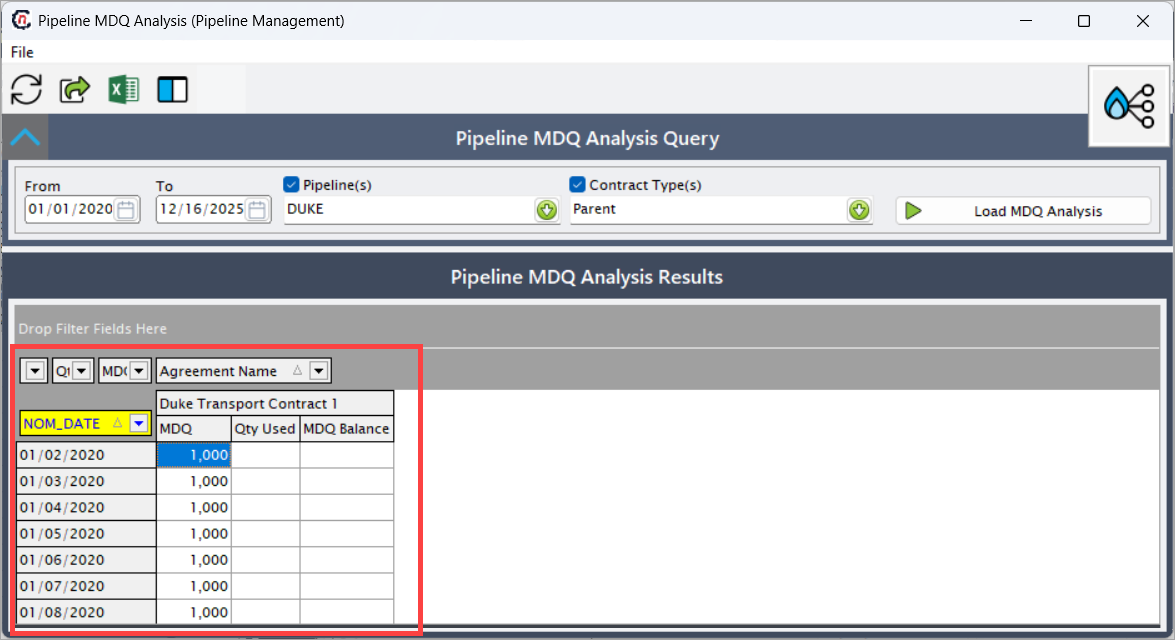
- Pipeline MDQ Analysis Query: This section controls which MDQ data is retrieved.
- Pipeline MDQ Analysis Results: This grid provides an aggregated view showing daily MDQ usage for each contract.
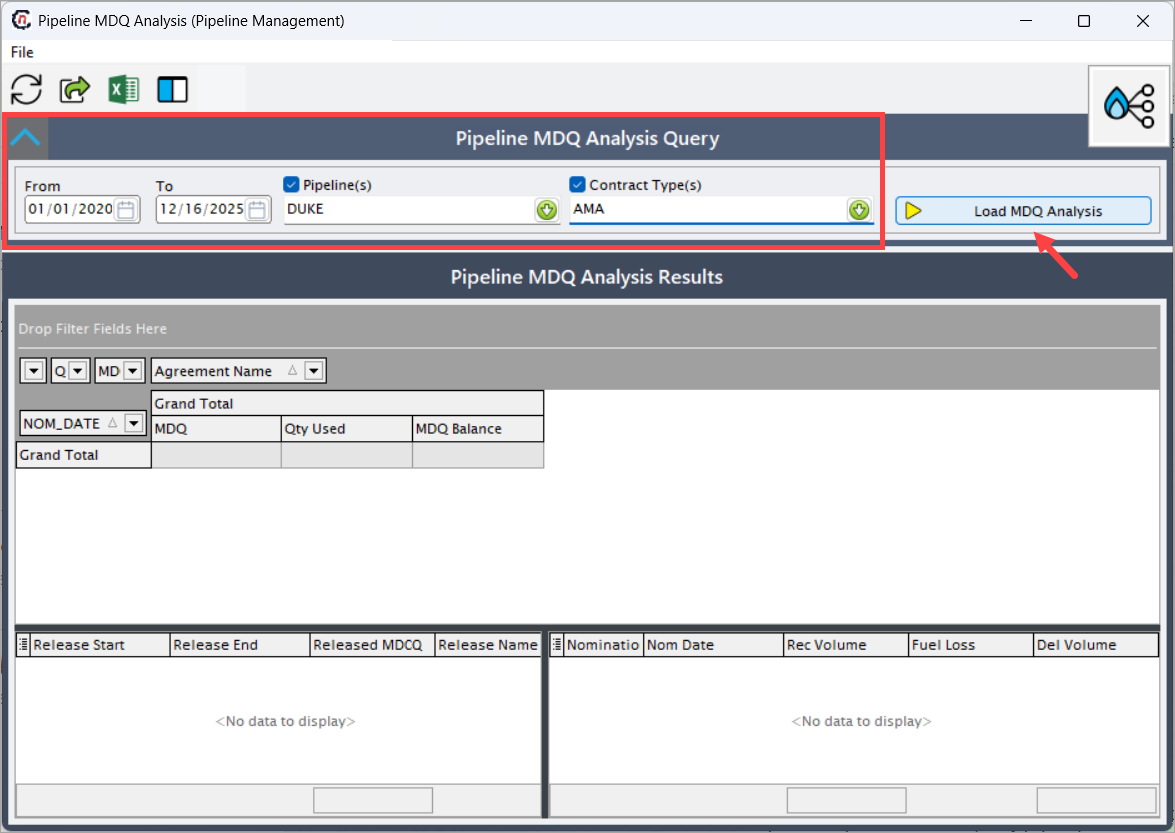
Step 2: Define filters in the Pipeline MDQ Analysis Query section
In this section, the user defines what MDQ information to retrieve.
| Fields | Description |
|---|---|
| From | The starting date of the analysis period. MDQ usage is evaluated beginning from this date. All nominations and MDQ entries earlier than this date are ignored. |
| To | The ending date of the analysis period. Users can analyze MDQ usage up to a future date or limit it to past historical usage. |
| Pipeline(s) | A list of available pipeline systems. Checking a pipeline ensures only MDQ data belonging to that pipeline is included. Multiple pipelines can be selected simultaneously for cross-pipeline MDQ review. |
| Contract Type(s) | Allows filtering MDQ data by contract category. MDQ is typically associated with firm transport contracts. |
Once filters are selected, click Load MDQ Analysis to populate the results section.
Step 3: Review the summarized MDQ results
This grid provides an aggregated view showing daily MDQ usage for each contract. The following information are displayed:
- Nom_Date: The gas day for which MDQ is being evaluated. All nomination activity referencing this date contributes to that day's MDQ usage.
- Agreement Name: The specific transportation contract used. This value groups MDQ usage by contract, allowing users to quickly determine which contract is nearing or exceeding its MDQ.
-
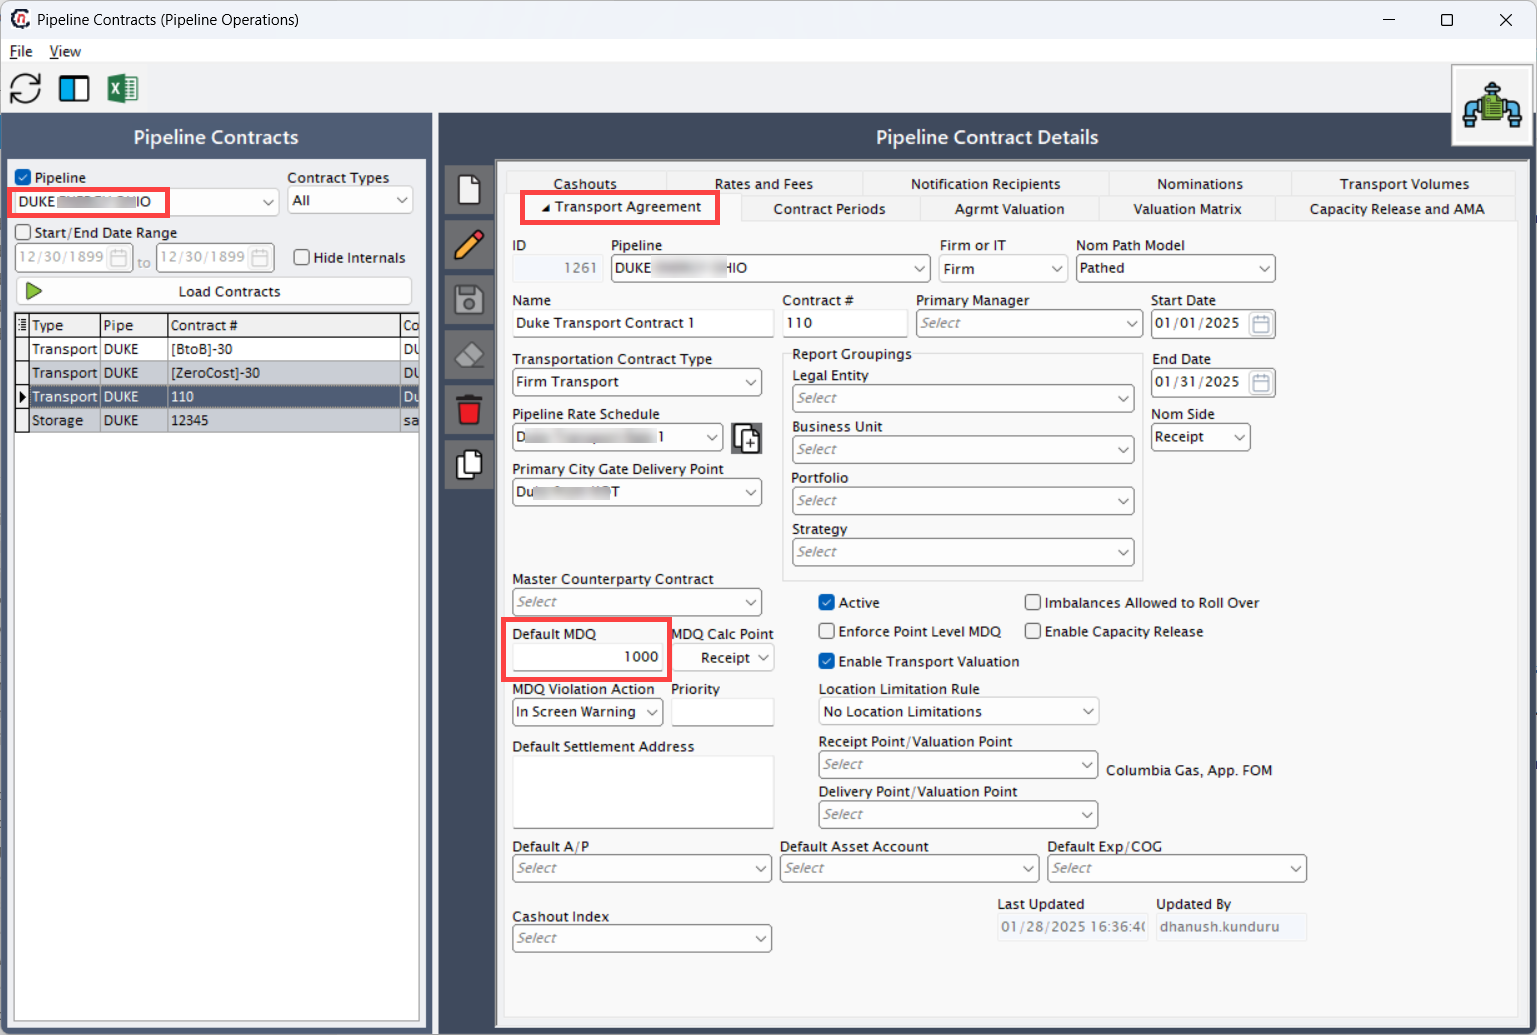
MDQ: Maximum Daily Quantity defined in the contract. This value is populated from the Pipeline Contract screen allotted in the Default MDQ Value field within the Transport Agreement section.
-
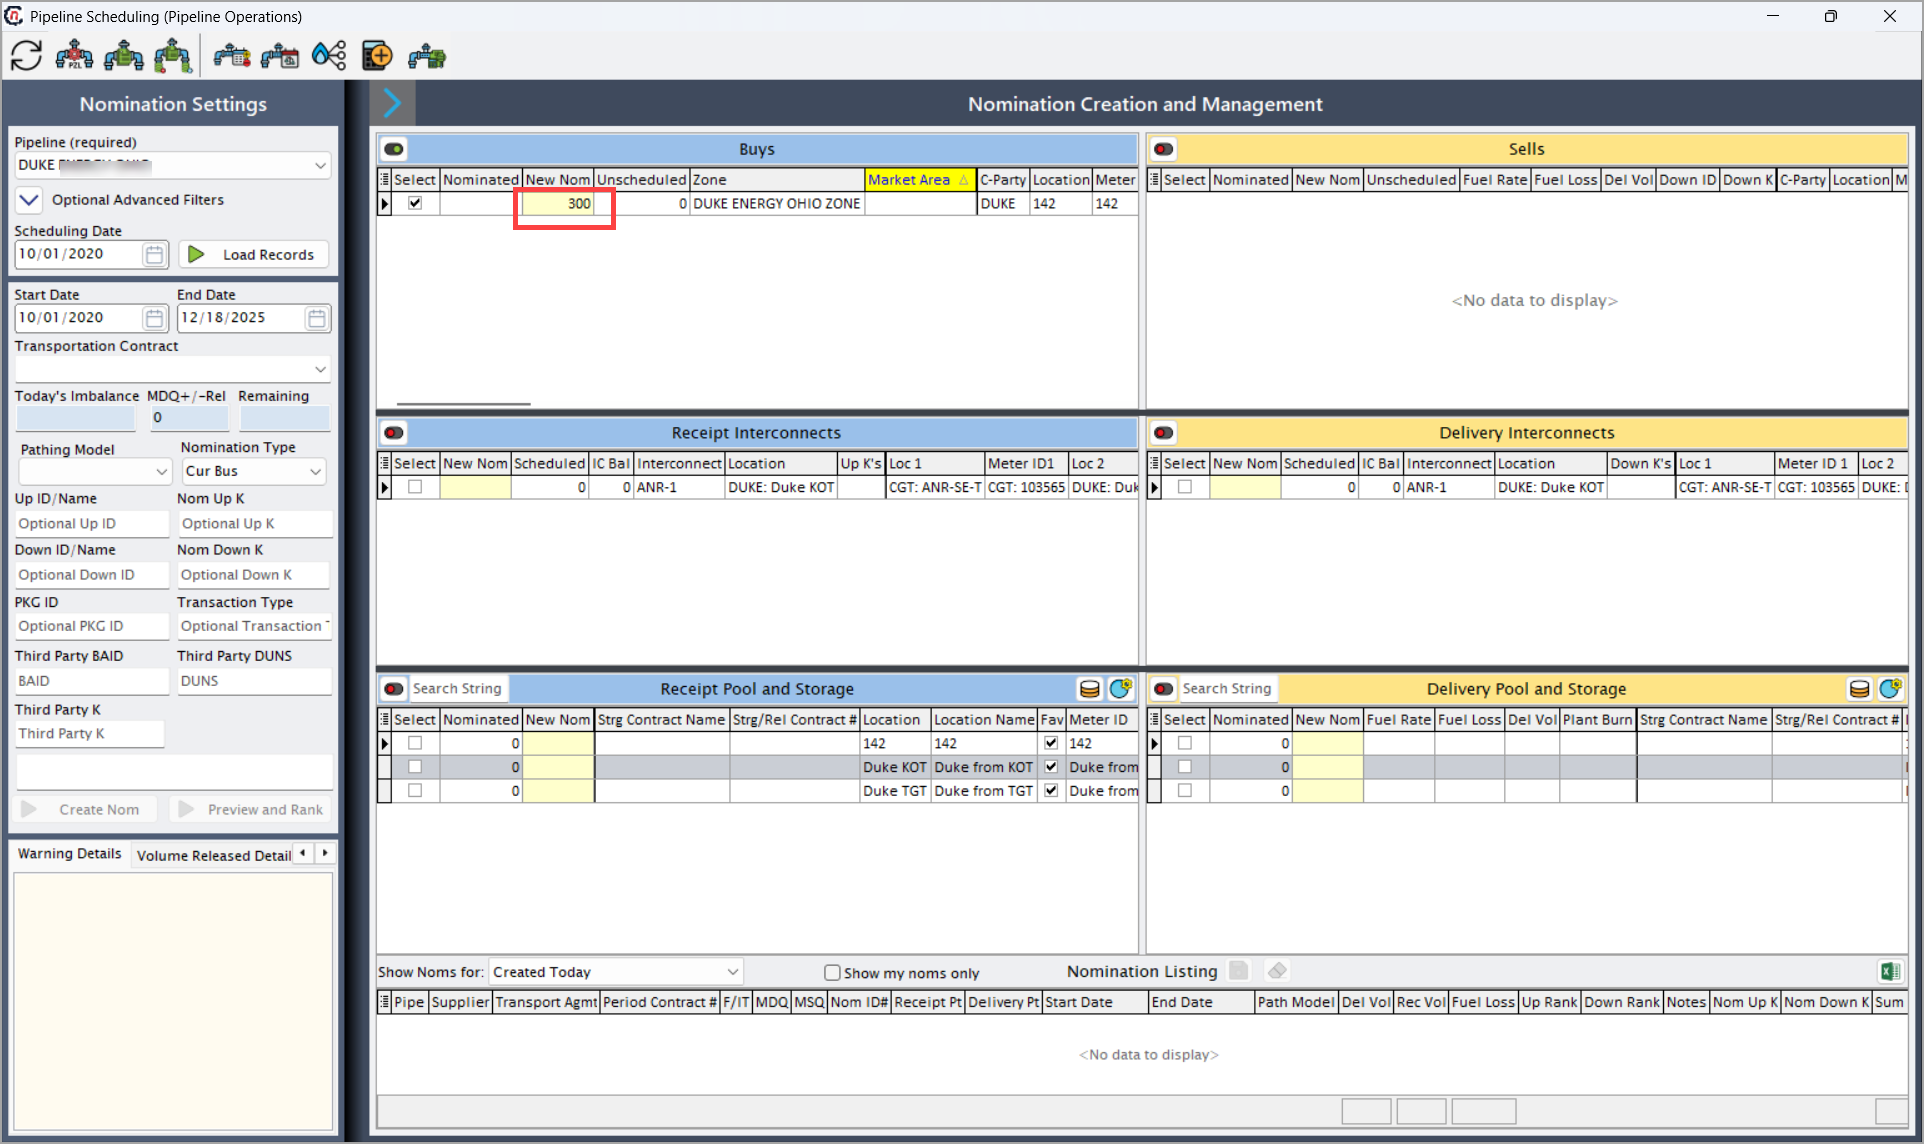
Qty Used: The total scheduled quantity for the gas day. It includes receipt volumes attributed to that contract. If multiple nominations exist, this number is the sum of all relevant nominations. The data is populated from the volume that you nominate in the Pipeline Scheduling screen.
-
MDQ Balance: The MDQ Balance is calculated as: MDQ – Qty Used. This is the remaining capacity available for the day. 0 means the contract is fully utilized.
This section helps analysts quickly see whether daily scheduled quantities approached or exceeded available MDQ.
Step 4: Review capacity release MDQ details
The bottom left grid displays capacity releases associated with the MDQ contract. If the pipeline supports capacity releases, part of the MDQ can be temporarily allocated to a replacement shipper.
| Fields | Description |
|---|---|
| Release Start | Start date of the release period where the contract holder transfers part of their MDQ to another party. Only MDQ within this timeframe is impacted. |
| Release End | Last date of the release period. After this date, MDQ fully returns to the contract holder. |
| Released MDCQ | The maximum daily contract quantity that has been released. This reduces the host shipper’s available MDQ during the release window. |
| Release Name | Identifier or description of the release record. Often reflects the replacement shipper or contract number. |
If no release activity exists, the grid will show No data to display.
Step 5: Review detailed Nomination-Level MDQ Usage
The bottom right grid shows detailed nomination data tied to the MDQ consumption.
| Fields | Description |
|---|---|
| Nomination # | Unique ID for the nomination transaction. Helps trace MDQ usage to a specific nomination. |
| Nom Date | The nomination date associated with the scheduled gas. Should correspond with NOM_DATE in the summary section. |
| Rec Volume | The receipt-side quantity nominated. This contributes directly to Qty Used. |
| Fuel Loss | Volume deducted as fuel for pipeline transportation. Does not change MDQ but affects net delivery. |
| Del Volume | The delivered volume after fuel adjustments. Reflects the net scheduled flow. |
The totals at the bottom row provide aggregate Rec and Del volumes for the selected period.
Step 6: Analyze results and validate MDQ usage
Once all data is loaded, the user can:
- Verify MDQ compliance
- Identify dates where MDQ was fully consumed
- Check whether releases reduced MDQ availability
- Confirm nomination volumes match usage totals
- Detect over-nominations or scheduling conflicts
This step ensures accurate MDQ planning and avoids contractual penalties.
Key points to remember
- MDQ values come directly from the transportation contract setup.
- MDQ Balance reaching zero indicates the contract is fully utilized for the day.
- Capacity releases reduce available MDQ and may cause MDQ Balance shortages.
- Fuel Loss does not impact MDQ calculations—it only affects delivered volume.
- Contract Type filtering helps analyze MDQ by AMA, FT, IT, etc.
- The collapsible top grid allows grouping by date, contract, or MDQ value.
Summary
The Pipeline MDQ Analysis screen provides a complete view of daily MDQ utilization, nomination consumption, and release-adjusted capacity. It helps operators and analysts:
- Monitor MDQ adherence
- Validate nomination behavior
- Identify contract limitations
- Ensure compliance with pipeline tariff rules
This screen is essential for daily scheduling, long-term contract management, and preventing MDQ overuse.