Reviewing profit and loss
The Profit and loss (credit and risk) screen provides a detailed financial overview of gas transactions, enabling the measurement of realized and unrealized margins across deals, portfolios, and business units. It consolidates revenues, costs, and exposures from both physical and financial trades to calculate overall profitability.
By providing deal-level visibility, the profit and loss process supports accurate financial reporting, helps assess trading performance, and ensures alignment between commercial operations and accounting results. It plays a critical role in validating daily or monthly profitability, reconciling market movements, and identifying variances impacting gross margins.
Prerequisites
Before working on the Profit and loss (credit and risk) screen, ensure the following prerequisites are met:
- Ensure nGenue application is installed and use valid login credentials to log into the application.
- User permissions: Configure the user permissions including User type, Security user, Security group, Security assign user, and Security assign permissions in their respective screens to enable access to the Profit and loss (Credit and risk) screen.
- Ensure LDC, End user, Facility, Counterparty, Deal management, Index curve definition and PZL are properly configured.
- Ensure Legal entity, Business unit, Portfolio, Strategy are fully configured in the Internal book structure.
Procedure to review profit and loss
Step 1: Navigate to the Profit and loss screen
- Log in to the nGenue application.
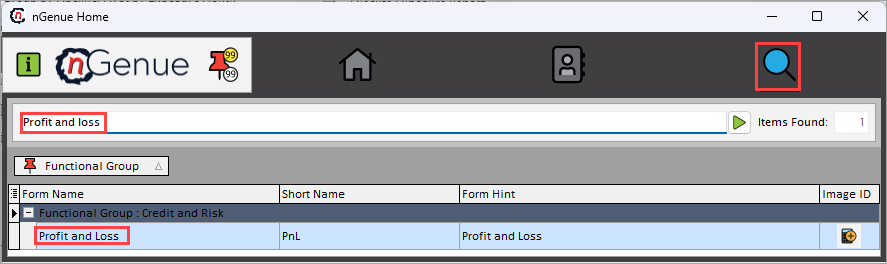
- Click the Search icon and enter Profit and loss in the search bar.
-
Double-click Profit and loss to open the respective screen.
-
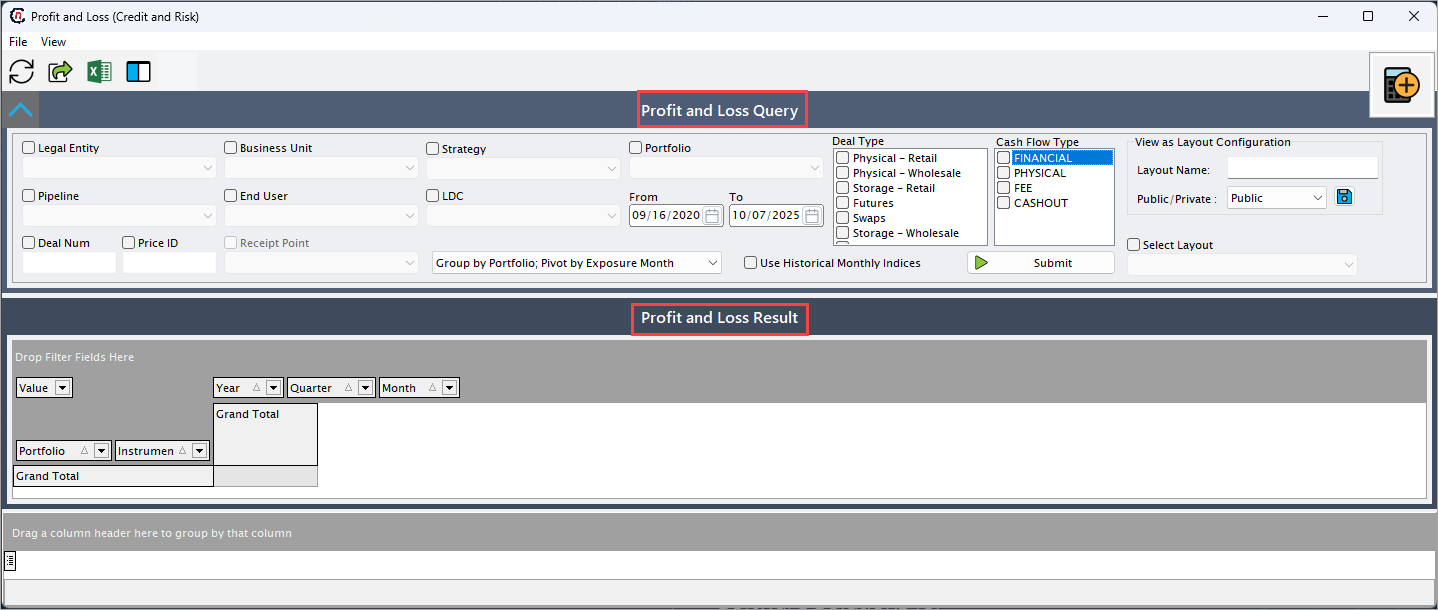
In the Profit and loss (credit and risk) screen, there are two sections
- Profit and loss query: This section provides filters that defines the parameters required to fetch the profit and loss records.
-
Profit and loss result: This section displays calculated profit and loss records based on query criteria.
Step 2: Execute profit and loss query
-
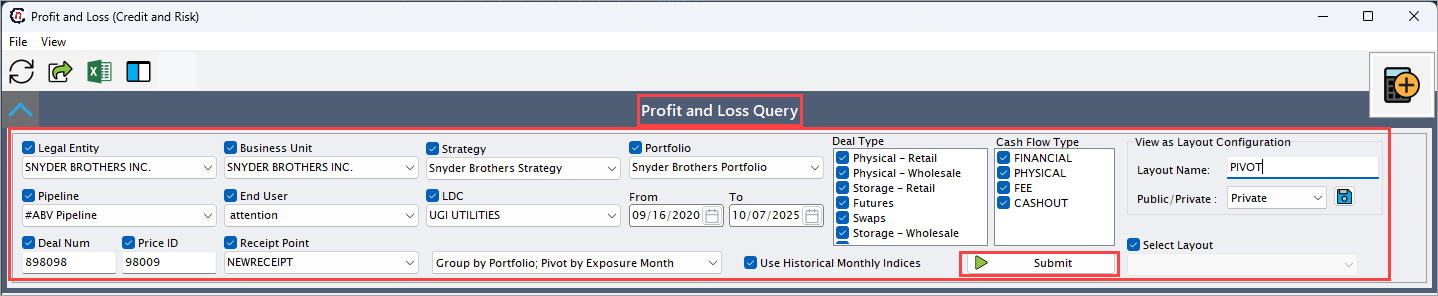
Complete the following required fields available in Profit and loss query section as mentioned in below table. Atleast one of the deal type must be selected to display the data.
Fields Description Legal entity Select the legal entity for which profit and loss is calculated to isolate the results as per legal entity for accurate reporting. Pipeline Select the pipeline to filter profit and loss data for a specific gas pipeline. Deal num Provide the deal number assigned to a specific deal to retrieve profit and loss data linked to that deal. Price ID Provide the reference ID assigned to price agreement tied to the specific deal. Business unit Select the business unit responsible for the deal to narrow the report to a specific business division. End user Select the end user associated with the deal. Receipt point Select the receipt point of the supply. Strategy Select the strategy tied to financial or physical instruments. LDC Select the LDC associated with specific end user to view data at end-user level for retail transactions. Portfolio Select the portfolio to display the profit and loss data tied to that specific portfolio. Group by Specify the grouping criteria to enable grouping of profit and loss data based on attributes such as pipeline, business unit, quarter, instrument, index group and pivot either by exposure month or location. From (to) Select the date range to fetch the profit and loss data for the chosen period. Use historical monthly indices Select this checkbox to apply historical index prices for valuation, as it provides backdated valuation based on actual past market prices. Deal type (Mandatory)
Fields Description Physical - retail Select this checkbox to include retail physical gas sale. Physical - wholesale Select this checkbox to include wholesale physical trades to show upstream or trading profit and loss impact. Storage - retail Select this checkbox to capture storage-related activities tied to retail operations and transactions. Futures Select this checkbox to add future contract for financial instruments. Swaps Select this checkbox to include swap deals to hedge price risks. Storage - wholesale Select this checkbox to capture storage-related activities tied to wholesale operations and transactions. Pipeline transportation Select this checkbox to include transportation costs and allocations. Pipeline imbalances Select this checkbox to include imbalances in pipeline operations and related transactions. Retail demand Select this checkbox to include the volume of gas bought at a specific price and time by the end user. Cash flow type
Fields Description Financial Select this checkbox to include only financial transactions such as futures, swaps. Physical Select this checkbox to include physical commodity flows affecting cash revenue. Fee Select this checkbox to capture service fees, transport charges, or other cost-based items. Cashout Select this checkbox to capture final settlement adjustments or balancing payments. View as layout configuration
Fields Description Layout name Select the name of saved report layout to display specific configuration for exposure data. Public/Private Select the visibility of the layout configuration either as public or private. Public layouts are accessible to all the users, while private layouts have a restricted access. Select layout Select the existing saved layout. When a layout is selected, the system automatically applies predefined filters, groupings, and column arrangements. -
Click Submit to display the profit and loss records.
Step 3: Review profit and loss data
-
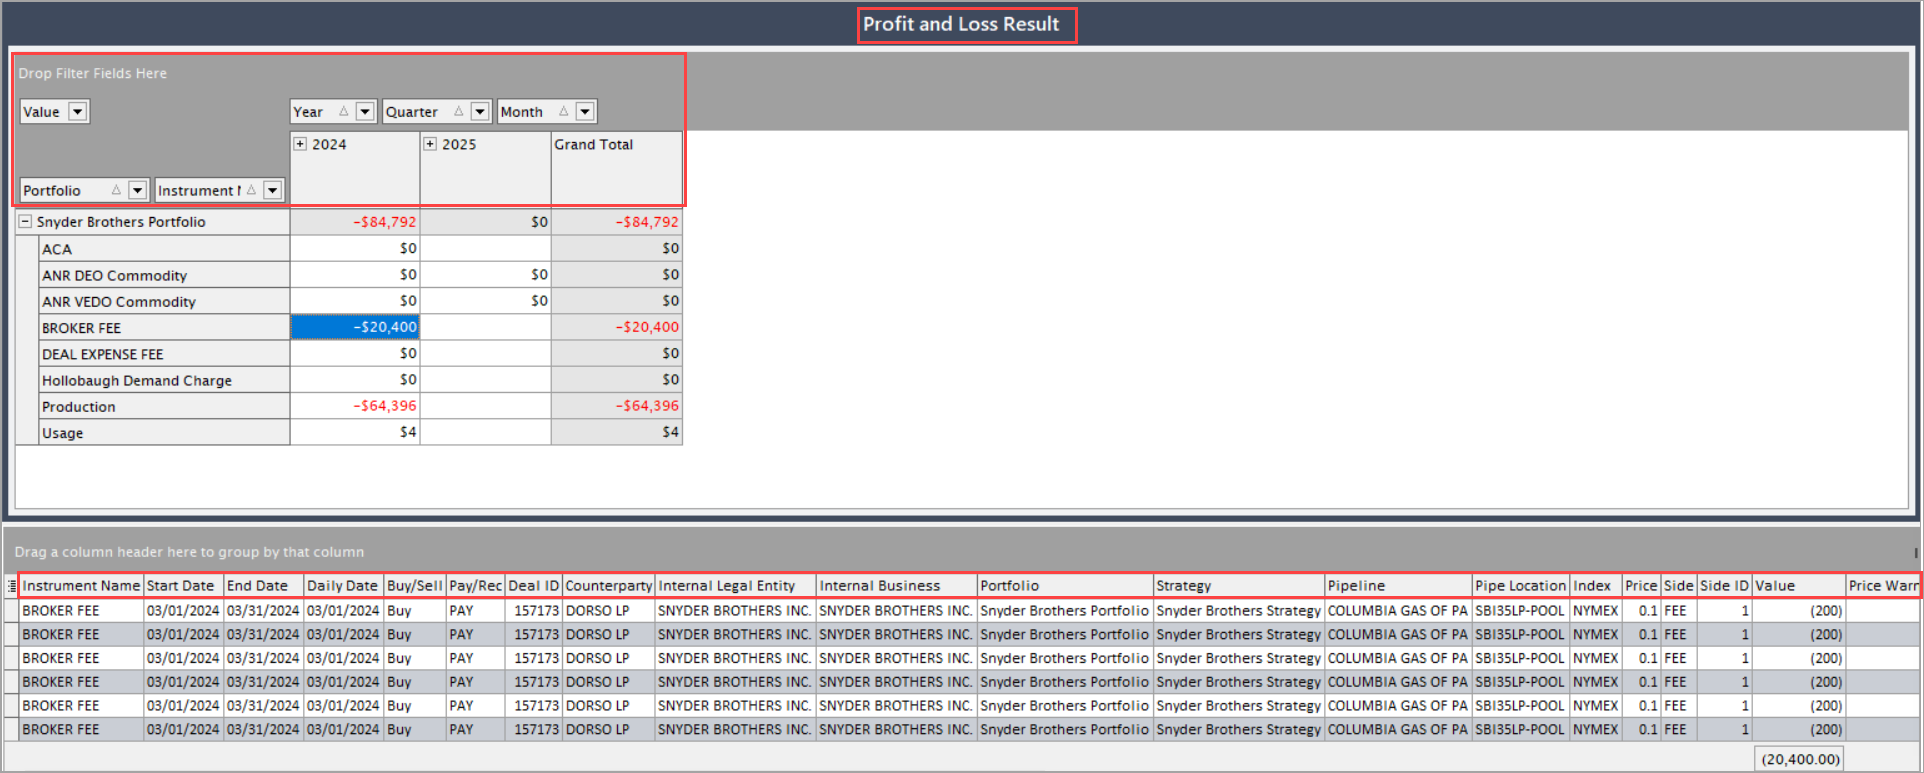
Upon executing the query, the price exposure records will be displayed in the Profit and loss results section based on the defined filters. Data fields can be rearranged dynamically using drag-and-drop functionality to organize the view.
The following table provides filterable row and column fields to drag and drop to display the related data:
Fields Description Portfolio Specifies the portfolio under which the aggregated profit and loss data is defined. Value Specifies the date and timestamp when the activity logged. Instrument Specifies associated instrument. Year Specifies the year for which the profit and loss data was calculated. Quarter Specifies the quarter for which the profit and loss data was calculated. Month Specifies the month for which the profit and loss data was calculated. -
Select a record to view its corresponding details. You can also adjust column configurations to refine or expand the displayed data in the data grid.
Summary
The Profit and loss screen provides a detailed and flexible view of financial performance across gas transactions and portfolios. It enables accurate profit validation, margin analysis, and exposure tracking while maintaining consistency between operational and accounting data. By integrating both physical and financial components, it supports transparent reporting, compliance, and informed decision-making in credit and risk management.