Review average weather history
The Average Weather History screen is used to review historical average daily weather metrics for a selected weather zone. It provides day-level averaged temperature and degree-day values that are used as foundational inputs for load profiling, demand forecasting, and degree-day–based calculations within nGenue.
This screen allows users to analyze long-term normalized weather patterns and validate the historical averages that drive downstream load profile and forecast calculations.
The Average Weather History screen enables users to:
- Review historical average high and low temperatures by day of year.
- Analyze heating and cooling degree day (HDD/CDD) averages.
- Validate weather data used in load profile and forecast calculations.
- Support degree-day–based demand modeling and analytics.
- Ensure consistency and transparency of weather inputs across calculations.
Prerequisites
Before reviewing the Average Weather History screen, ensure the following prerequisites are met:
- The user has view or modify permissions for the Average Weather History screen.
- Weather zones are configured and active in nGenue.
- Historical weather data is available for the configured weather zones.
- Degree day calculation parameters (base temperatures) are defined in the system.
Procedure to review average weather history
Step 1: Navigate to the Average Weather History screen
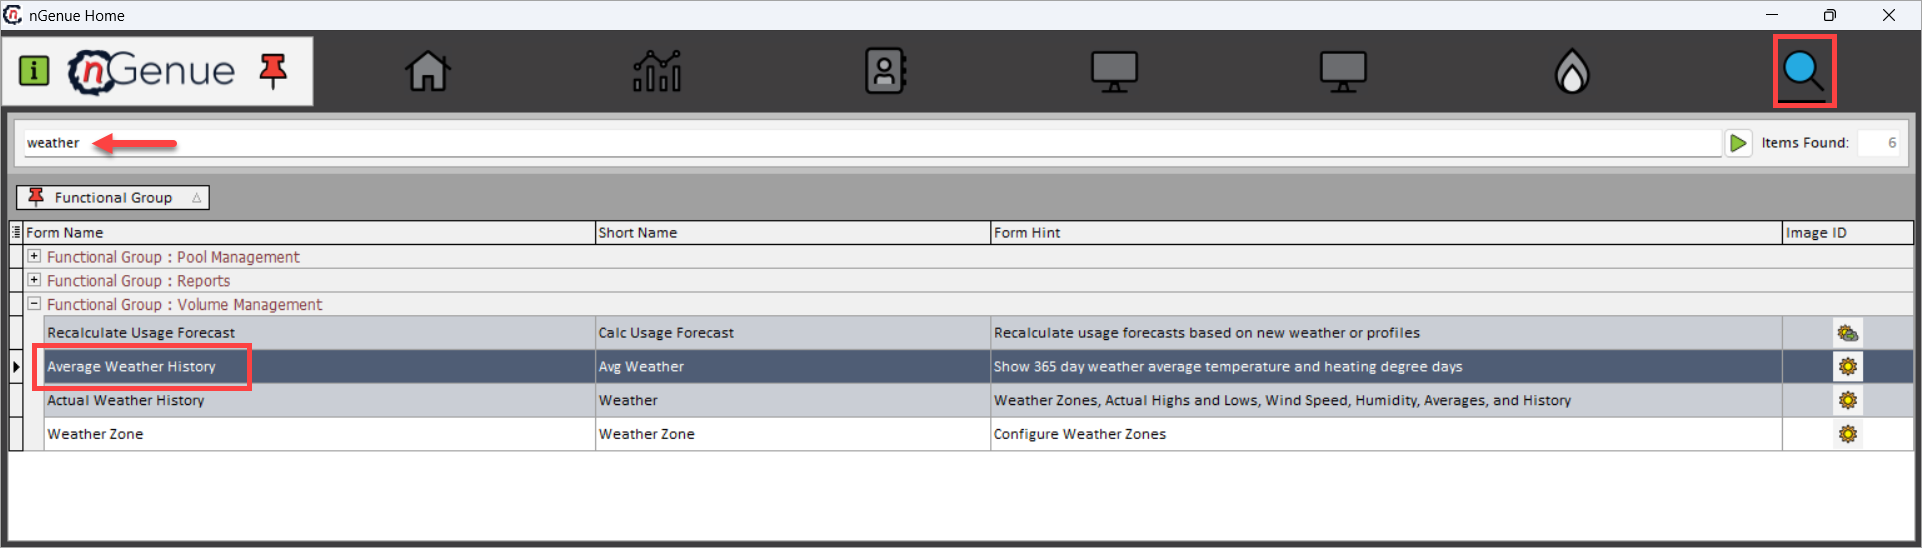
- Log in to the nGenue application.
- Click the Search icon and enter Weather in the search bar.
- Double-click Average Weather History to open the Average Weather History (Volume Management) screen.
- The screen is divided into the following sections:
- Weather Zone Query: This section is used to define which historical weather averages are loaded.
- Average Weather Details: This section displays historical average weather values organized by day of year. Each row represents a specific calendar day, with values averaged across historical years.
Step 2: Select weather zone and load averages
- In the Weather Zone Query section, select the weather zone for which average historical weather data should be reviewed. Weather zones typically represent geographic regions used for load profiling and forecasting.
-
Click Load Weather Zone Averages.
-
This loads historical average weather data into the Average Weather Details grid.
Step 3: Review average weather details
The Average Weather Details section displays historical average weather values organized by day of year. Each row represents a specific calendar day, with values averaged across historical years.
| Fields | Description |
|---|---|
| Day of Year | Sequential day number within the calendar year (1–365 or 366). This field is used to align weather data with load profile calculations independent of year. |
| Date | Calendar date corresponding to the day of year (for example, January 1, February 15). This is a reference label and does not represent a specific year. |
| Avg High | Average historical daily high temperature for the selected weather zone on this day of the year. This value is derived from multiple years of observed data. |
| Avg Low | Average historical daily low temperature for the selected weather zone on this day of the year. |
| Avg HDD | Average Heating Degree Days for the day, calculated using the configured HDD base temperature. HDD values represent heating-driven demand sensitivity. |
| Avg CDD | Average Cooling Degree Days for the day, calculated using the configured CDD base temperature. CDD values represent cooling-driven demand sensitivity. |
Key points
- Weather zones must be configured before averages can be reviewed.
- Values are historical averages, not actual daily weather.
- HDD and CDD values depend on configured base temperatures.
- Day-of-year indexing ensures consistent alignment with load profiles.
- This screen is read-only and analytical in nature.
- Accuracy of this data is critical for downstream load and forecast calculations.
Summary
The Average Weather History screen provides a transparent and normalized view of historical average weather conditions by day of year for a selected weather zone. By exposing average temperatures and degree-day values in a structured, review-focused format, this screen ensures confidence in the weather inputs used for load profiling, forecasting, and demand analytics.